Contents
2.5 LANDSCAPE AND VISUAL Monitoring
2.8 IMPLEMENTATION STATUS OF
ENVIRONMENTAL MITIGATION MEASURES
2.9 Summary of Exceedances of the
Environmental Quality Performance Limit
2.10 Summary of
Complaints, Notification of Summons and Successful Prosecutions
Annex
B
ENVIRONMENTAL MITIGATION IMPLEMENTATION SCHEDULE
Annex
C
MONITORING SCHEDULE FOR THIS REPORTING PERIOD
Annex D Air Quality
Annex
D1 24-hour
tsp monitoring results
Annex
D2 event
and action plan for air quality monitoring
Annex
D4 ODOUR
MONITORING results
Annex
D6 ambient
vocs, AMMONIA AND h2s monitoring results
Annex
D7 INVESTIGATION
REPORTS OF ENVIRONMENTAL QUALITY LIMIT EXCEEDANCE
Annex E Noise
Annex
E1
NOISE MONITORING RESULTS
Annex
E2
EVENT AND ACTION PLAN FOR NOISE MONITORING
Annex F Water Quality
Annex
F1
SURFACE WATER QUALITY MONITORING RESULTS
Annex
F2
EVENT AND ACTION PLAN FOR WATER QUALITY MONITORING
Annex
F3
LEACHATE LEVELS MONITORING RESULTS
Annex
F4
EFFLUENT QUALITY MONITORING RESULTS
Annex
F5
GROUNDWATER MONITORING RESULTS
Annex
F6
INVESTIGATION REPORTS OF ENVIRONMENTAL QUALITY LIMIT EXCEEDANCE
Annex G Landfill Gas
Annex
G2 LANDFILL
GAS MONITORING RESULTS
Annex
G3 EVENT
AND ACTION PLAN FOR LANDFILL GAS MONITORING
Annex G4 INVESTIGATION REPORTS OF ENVIRONMENTAL QUALITY LIMIT EXCEEDANCE
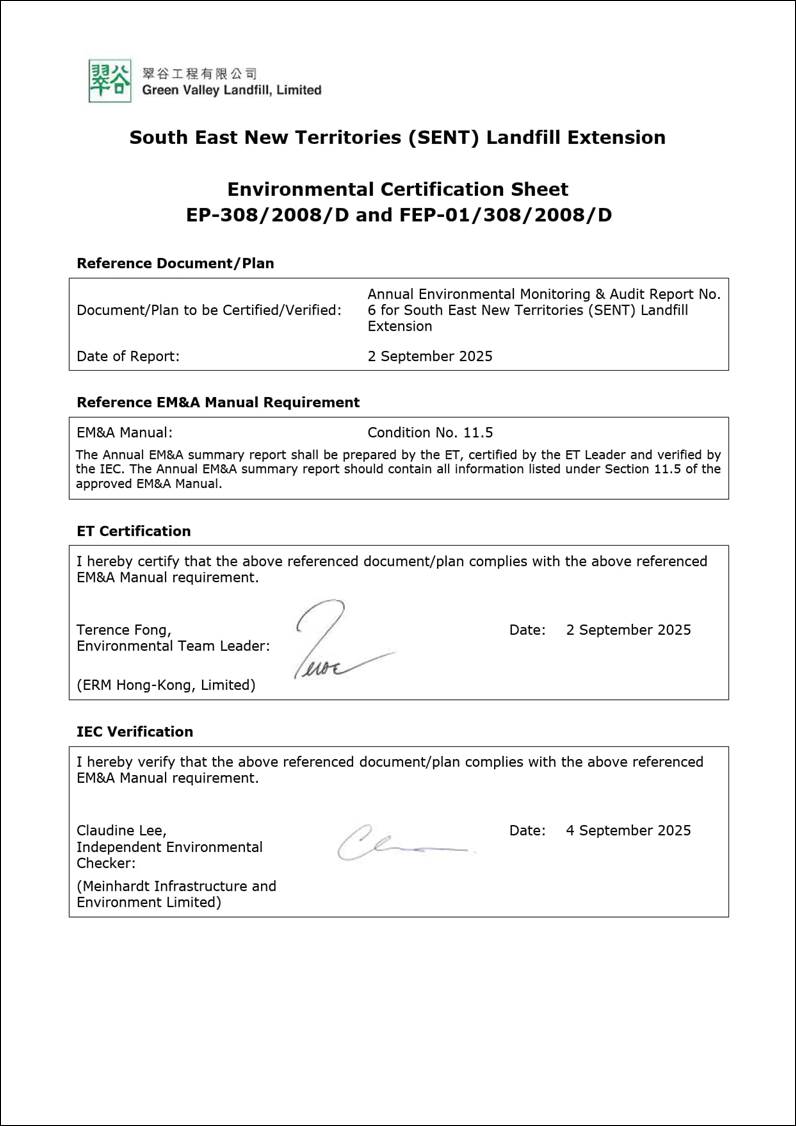
This Annual
EM&A report presents the EM&A works carried out during the period from
1 January 2024 to 31 December 2024 for
the Project in accordance with the updated EM&A Manual.
Four exceedances of Action and Limit Levels for dust
(TSP), two exceedances of Limit Level for landfill gas flare stack emission (Benzene) and
one exceedance of Limit
Levels for landfill gas flare stack emission (carbon monoxide (CO)) were
recorded for air quality monitoring in the reporting period.
The TSP exceedances at AM1 on 2 and 8 January 2024, 14
and 26 March 2024 were considered non Project-related
upon further investigation.
The landfill
gas flare stack emission (Benzene and CO) exceedances on 18 April 2024 and
landfill gas flare stack emission (Benzene) exceedance on 9 May 2024 were
considered Project-related upon further investigation.
No exceedance of Action and Limit Levels for
operation/restoration phase noise monitoring was recorded in the reporting
period.
One exceedance of the Limit Levels for surface water
(ammoniacal-nitrogen), two exceedances of the Limit Levels for surface water
(suspended Solids (SS)), four exceedances of the Limit Level for groundwater
(ammoniacal-nitrogen), twelve exceedances of the Limit Level for
groundwater (COD) were recorded for water quality impact monitoring in the
reporting period.
The surface
water (ammoniacal-nitrogen) exceedance at DP3 and the surface water (SS)
exceedances at DP4 and DP6 on 6 May 2024 and 12 June 2024, respectively, were
found deemed to Project-related activities upon further investigation.
The
groundwater (ammoniacal-nitrogen) exceedance at MWX-6 on 6 March 2024, at MWX-5
on 3 May 2024, and at MWX-7 on 5 August 2024 and 3 December 2024 were
considered non Project-related upon further
investigation. The groundwater (COD) exceedances at MWX-5 on 3 May 2024, at
MWX-6 on 8 January 2024, 1 February 2024, 6 March 2024, 10 April 2024 and 3 May
2024, at MWX-7 on 12 June 2024, 5 July 2024 and 5 August 2024 and 3 December
2024, at MWX-8 on 6 March 2024 and at MWX-9 on 5 July 2024 were considered non
Project-related upon further investigation.
One exceedance of the Limit Level for perimeter
landfill gas (carbon dioxide) was recorded for landfill gas monitoring in the
reporting period. The perimeter landfill gas (carbon dioxide) exceedance at
LFG17 on 13 August 2024 was considered non Project-related
upon further investigation.
There were no complaints, notification
of summons or prosecution recorded in the reporting period.
There was no reporting change in the reporting
period.
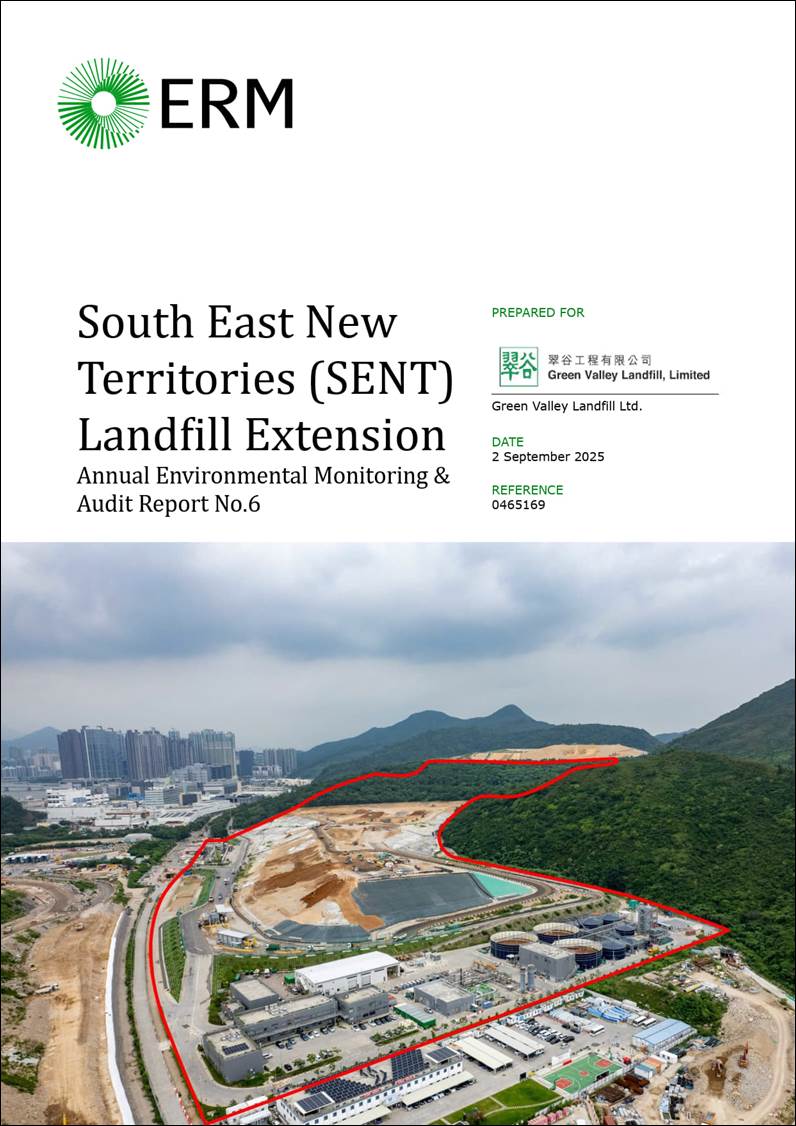
The SENT Landfill Extension (SENTX) forms an integral part in the
Strategic Plan in maintaining the continuity of landfill capacity in the Hong
Kong for the cost-effective and environmentally satisfactory disposal of waste.
The Environmental Impact Assessment (EIA) Report and the associated Environmental
Monitoring and Audit (EM&A) Manual
for the construction,
operation, restoration and aftercare of the SENTX (hereafter referred to as
“the Project”) have been approved under the Environmental Impact Assessment
Ordinance (EIAO) in May 2008 (Register No.: AEIAR-117/2008)
(hereafter referred to as the approved EIA Report) and an Environmental Permit
(EP-308/2008) (EP) was granted by the Director of Environmental Protection
(DEP) on 5 August 2008.
Since then, applications for Variation of an
Environmental Permit (No. VEP-531/2017) were submitted to EPD and the Variation
of Environmental Permits (EP-308/2008/A and EP-308/2008/B) were granted on 6
January 2012 and 20 January 2017, respectively, as the Hong Kong SAR Government
has decided to reduce the scale of the design scheme of SENTX assessed in the
approved EIA Report and SENTX will only receive construction waste. In May
2018, a Further Environmental Permit (FEP) (FEP-01/308/2008/B) was granted to
the SENTX contractor, Green Valley Landfill, Limited (GVL). In February 2024,
VEPs (EP-308/2008/C and FEP-01/308/2008/C) were granted to the Environmental
Infrastructure Division of EPD and GVL, regarding updates on alternative
measures to minimise surface odour
emission.
ERM-Hong Kong,
Limited (ERM) and Meinhardt Infrastructure and Environment Limited (Meinhardt)
are commissioned to undertake the roles of Environmental Team (ET) and the
Independent Environmental Checker (IEC), respectively, to undertake the
EM&A activities for the Project in accordance with the requirements
specified in the EP, updated EM&A Manual ([1]),
approved EIA Report ([2])
taking account of the latest design and other relevant statutory requirements.
The SENTX
is a piggyback landfill, occupying the southern part of the existing SENT
Landfill (including its infrastructure area) and 13 ha of Tseung Kwan O (TKO)
Area 137. A layout plan of the SENTX is shown in Figure 1.1. Under the latest design, the SENTX has a
net void capacity of about 6.5 Mm3 and provides an additional
lifespan of about 6 years, commencing operation upon exhaustion of the SENT
Landfill. The SENTX will receive construction waste only.
The key
implementation milestones of the Project are indicatively summarised
in Table 1.1. The construction works and operation of the Project
commenced on 2 January 2019 and 21 November 2021, respectively.
Table 1.1 Estimated Key Dates of Implementation
Programme
|
Key Stage of the Project |
Indicative Date |
|
Start construction |
2 January 2019 |
|
Commissioning of new infrastructure facilities |
2020 |
|
Demolition of existing infrastructure facilities |
2021 |
|
Start waste intake at SENTX |
21 November 2021 |
|
Estimated exhaustion date of SENTX |
2027 |
|
End of aftercare for SENTX |
2057 |
The major construction
works of the SENTX includes:
• Site formation at the TKO Area 137
and the existing infrastructure area at SENT Landfill;
• Construction of surface and
groundwater drainage systems;
• Construction of the leachate
containment and collection systems;
• Construction of new leachate and
landfill gas treatment facilities, site offices, maintenance yards at the new
infrastructure area;
• Construction of new pipelines to
transfer the leachate and landfill gas collected from the existing SENT
Landfill to the treatment facilities at the new infrastructure area;
• Construction of the site access and
new waste reception facilities; and
• Demolition of the facilities at the
existing SENT Landfill infrastructure area.
This is the
Annual EM&A Report for the Project which summarises
the key findings of the EM&A programme during the
reporting period from 1 January 2024 to 31 December 2024 for the construction
and operation works.
The organisation structure of the Project is presented in Figure
1.2.
Figure
1.2 Organisation Chart
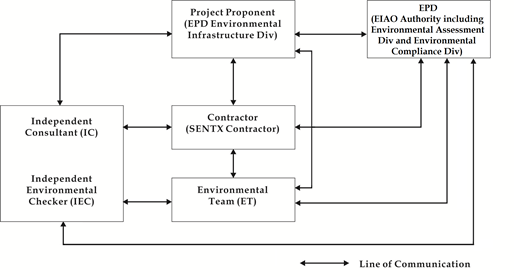
Contact
details of the key personnel are summarised in Table
1.2 below.
Table 1.2 Contact Information of Key Personnel
|
Party |
Position |
Name |
Telephone |
|
Contractor (Green Valley Landfill Limited) |
Project Manager |
Carl Lai |
2706 8829 |
|
Environmental Team (ET) (ERM-Hong Kong, Limited) |
ET Leader |
Terence Fong |
2271 3156 |
|
Independent Environmental Checker (IEC) (Meinhardt Infrastructure and Environment Limited) |
IEC |
Claudine Lee |
2859 5409 |
The programme of the construction is shown in Annex A. As informed by the
Contractor, the major works carried out in this reporting period include:
January 2024
• Maintenance
and improvement of temporary surface water drainage;
• Weighbridge enhancement with C-easy;
• Testing
and commissioning works at Diesel Fuel Tank; and
• Restoration
of Phase 1 Cell 1X, 2X and Phase 2 Cell 3X west slopes.
February 2024
• Maintenance
and improvement of temporary surface water drainage;
• Weighbridge
enhancement with C-easy;
• Testing
and commissioning works at Diesel Fuel Tank; and
• Restoration
of Phase 1 Cell 1X, 2X and Phase 2 Cell 3X west slopes.
March 2024
• Maintenance and improvement of
temporary surface water drainage; and
• Restoration
of Phase 1 Cell 1X, 2X and Phase 2 Cell 3X west slopes.
April 2024
• Maintenance
and improvement of temporary surface water drainage; and
• Restoration
of Phase 1 Cell 1X, 2X and Phase 2 Cell 3X west slopes.
May 2024
• Maintenance
and improvement of temporary surface water drainage; and
• Restoration
of Phase 1 Cell 1X, 2X and Phase 2 Cell 3X west slopes.
June 2024
• Maintenance
and improvement of temporary surface water drainage; and
• Restoration
of Phase 1 Cell 1X, 2X and Phase 2 Cell 3X west slopes.
July 2024
• Maintenance
and improvement of temporary surface water drainage; and
• Restoration
of Phase 1 Cell 1X, 2X and Phase 2 Cell 3X west slopes.
August 2024
• Maintenance
and improvement of temporary surface water drainage; and
• Restoration
of Phase 1 Cell 1X, 2X and Phase 2 Cell 3X west slopes.
September 2024
• Maintenance
and improvement of temporary surface water drainage; and
• Restoration
of Phase 1 and Phase 2 slopes.
October 2024
• Maintenance
and improvement of temporary surface water drainage; and
• Restoration
of Phase 1 and Phase 2 slopes.
November 2024
• Maintenance
and improvement of temporary surface water drainage; and
• Restoration
of Phase 1 and Phase 2 slopes.
December 2024
• Maintenance
and improvement of temporary surface water drainage; and
• Restoration
of Phase 1 and Phase 2 slopes.
· Restoration of Phase 1 Cell 1X.
The
implementation schedule of the mitigation measured recommended in the Updated
EM&A Manual is presented in Annex
B.
The status
for all environmental aspects are presented in Table
1.3. The EM&A requirements remained unchanged during the
reporting period.
Table 1.3 Summary of Status for the Environmental Aspects
under the Updated EM&A Manual
|
Parameters |
Status |
|
Air Quality |
|
|
Baseline Monitoring |
The results of baseline air quality monitoring were reported in Baseline Monitoring Report and Pre-operation Baseline Monitoring Report and submitted to EPD under EP Condition 3.3 |
|
Impact Monitoring |
On-going |
|
Noise |
|
|
Baseline Monitoring |
The results of baseline noise monitoring were reported in Baseline Monitoring Report and submitted to EPD under EP Condition 3.3 |
|
Impact Monitoring |
On-going |
|
Water Quality |
|
|
Baseline Monitoring |
The results of baseline surface water quality monitoring were reported in Baseline Monitoring Report and Pre-operation Baseline Monitoring Report and submitted to EPD under EP Condition 3.3 |
|
Impact Monitoring |
On-going |
|
Landfill Gas |
|
|
Impact Monitoring |
On-going |
|
Waste Management |
|
|
Waste Monitoring |
On-going |
|
Landscape and Visual |
|
|
Baseline Monitoring |
The results of baseline landscape and visual monitoring were reported in Baseline Monitoring Report and submitted to EPD under EP Condition 3.3 |
|
Operation Phase Audit |
On-going |
|
Site Environmental Audit |
|
|
Regular Site Inspection |
On-going |
|
Complaint Hotline and Email Channel |
On-going |
|
Environmental Log Book |
On-going |
Taking into account the operation works, impact
monitoring of air quality, noise, water quality, landfill gas and waste
management were carried out in the reporting period. The impact monitoring
schedule of air quality, noise, water quality and landfill gas monitoring are provided
in Annex C.
The
EM&A programme also involved environmental site
inspections and related auditing conducted by the ET for checking the
implementation of the required environmental mitigation measures recommended in
the approved EIA Report and relevant EP submissions. To promote the environmental awareness and enhance the environmental
performance of the contractors, environmental trainings
and regular environmental management meetings were conducted during the
reporting period, which are summarized as below:
·
Twelve
environmental management
meetings were held with the Contractor, ER, ET, IEC and EPD on 18 January 2024,
22 February 2024, 21 March 2024, 24 April 2024, 23 May 2024, 20 June 2024, 18
July 2024, 15 August 2024, 26 September 2024, 24 October 2024, 21 November 2024
and 18 December 2024; and
·
Environmental
toolbox trainings on the following topics were
provided by the Contractor to the workers:
·
Persistent Organic Pollutant on
18 January 2024;
·
Trip Ticket System on 24 January 2024;
·
Indoor Air Quality on 8 February 2024;
·
Green Procurement on 20 February 2024;
·
Non-road Mobile Machinery (NRMM) on 13
March 2024;
·
Waste Reduction in Construction Industry on 21
March 2024;
·
Cut Down Construction Dust on 10 April 2024;
·
Mosquito Prevention for Workers in Construction
Sites on 25 April 2024;
·
Renewable Energy on 16 May 2024;
·
Chemical Waste Handling on 21 May 2024;
·
Wastewater Management on 13 June 2024;
·
Quality Powered Mechanical Equipment (QPME) on
18 June 2024;
·
Good Vehicle Maintenance Practices on 11 July 2024;
·
Air Pollution Dark Smoke on 30 July 2024;
·
Coverage of Regulated Electrical Equipment (REE)
Expanded on 8 August 2024;
·
Mosquito Nuisance on 22 August 2024;
·
Wastewater Handling, Discharge and Treatment
Facility on 12 September 2024;
·
Tree Protection Zone on 26 September 2024;
·
Illegal Dumping on 10 October 2024;
·
Noise control ordinance on 17 October 2024;
·
Housekeeping (Material Storage) on 19 November 2024;
·
Indoor Air Quality on 26 November 2024;
·
Site Practice for Waste Reduction in
Construction Industry on 31 December 2024; and
·
Recycling on 31 December 2024.
The status
of statutory environmental compliance with the EP conditions under the EIAO,
submission status under the EP and implementation status of mitigation measures
are presented in Table 1.4.
Table 1.4 Status of Submissions required under the EP and
Implementation Status of Mitigation Measures
|
EP Condition |
Submission / Implementation Status |
Status |
|
2.3 |
Management Organisation of Main Construction Companies |
Submitted and accepted by EPD. |
|
2.4 |
Setting up of Community Liaison Group |
Community Liaison Group was set up. |
|
2.5 |
Submission of Detailed Landfill Gas Hazard Assessment Report |
Submitted and accepted by EPD on 10 January 2019. |
|
2.6 |
Submission of Restoration and Ecological Enhancement Plan |
Submitted to EPD on 28 June 2019. |
|
2.7 |
Setting up of Trial Nursery |
Trial Nursery works was commenced on 28 August 2019. |
|
2.8 |
Advance Screen Planting |
Advance Screen Planting works were completed on 28 June 2019. |
|
2.9 |
Provision of Multi-layer Composite Liner System |
Under implementation. |
The
environmental licenses and permits (including EP, Water Pollution Control
Ordinance (WPCO) discharge license, registration as a chemical waste
producer, and construction noise permit) that are valid in the reporting period
are presented in Table 1.5. No non-compliance with environmental
statutory requirements was identified.
TABLE 1.5 STATUS OF STATUTORY
ENVIRONMENTAL REQUIREMENTS
|
Description |
Ref No. |
Status |
||
|
Environmental Permit |
EP-308/2008 |
Granted on 5 August 2008 |
||
|
Variation of Environmental Permit |
EP-308/2008/A |
Granted on 6 January 2012 |
||
|
EP-308/2008/B |
Granted on 20 January 2017 |
|||
|
EP-308/2008/C |
Granted on 29 February 2024 |
|||
|
Further Environmental Permit |
FEP-01/308/2008/B |
Granted on 16 May 2018 |
||
|
FEP-01/308/2008/C |
Granted on 29 February 2024 |
|||
|
Water Discharge License under WPCO (Permit Holder: GVL) |
Licence No.: WT00041447-2022 |
Validity from 17 June 2022 to 30
June 2024 |
||
|
Licence No.: WT10003277-2024 |
Validity from 23 August 2024 to 30
June 2026 |
|||
|
Billing Account for Disposal of Construction Waste |
Chit Account Number: 5001692 |
Approved on 28 December 2005 |
||
|
Registration as a Chemical Waste Producer (Permit Holder: GVL) |
5296-839-G2228-01 |
Issued on 31 December 2015 |
||
|
Construction Noise Permit (Permit Holder: GVL) |
GW-RE1146-23 |
Validity from 15 September 2023 to
14 March 2024 |
||
|
GW-RE0307-24 |
Validity from 22 March 2024 to 14
September 2024 |
|
||
|
GW-RE1103-24 |
Validity from 15 September 2024 to
14 March 2025 |
|
||
The
EM&A programme for the Project required
environmental monitoring for air quality, noise, water quality and landfill gas
as well as environmental site inspections for air quality, noise, water
quality, landfill gas, waste management, and landscape and visual impacts. The
EM&A requirements and related findings for each component are summarised in the following sections.
According
to the updated EM&A Manual of the Project, impact dust monitoring (in term
of Total Suspended Particulates (TSP)) was carried out at the four designated
locations along the site boundary (i.e. AM1, AM2, AM3 and AM4) during the
operation/restoration phase, at a 6-day interval.
The Action
and Limit Levels of the dust monitoring is provided in Table 2.1 below.
Table 2.1 Action and Limit Levels for 24-hour TSP
|
Monitoring Station |
Action Level |
Limit Level |
|
AM1 - SENTX Site Boundary (North) |
• 260 µg m-³ |
• 260 µg m-³ |
|
AM2 - SENTX Site Boundary (West, near DP3) |
||
|
AM3 - SENTX Site Boundary (West, near RC15) |
||
|
AM4 - SENTX Site Boundary (West, near EPD building) |
High volume
air samplers (HVSs) in compliance with the specifications listed under Section
3.2.2 of the updated EM&A Manual were used to measure 24-hour TSP levels at
the dust monitoring stations. The HVSs were calibrated upon installation and
thereafter at bi-monthly intervals to check the validity and accuracy of the
results.
The
equipment used in the impact dust monitoring programme
and monitoring locations are summarised in Table
2.2 and illustrated in Figure 2.1, respectively.
Table 2.2 Dust Monitoring Details
|
Monitoring Station |
Location |
Parameter |
Frequency and Duration |
Monitoring Dates |
Equipment |
|
AM1 |
SENTX Site Boundary (North) |
• 24-hour TSP |
• Once every 6 days |
2, 8, 14, 20, 26 Jan
2024 1, 7, 13, 19, 25
Feb 2024 2, 8, 14, 20, 26
Mar 2024 1, 7, 13, 19, 25
Apr 2024 1, 7, 13, 19, 25,
31 May 2024 6, 12, 18, 24, 30
Jun 2024 6, 12, 18, 24,
30 Jul 2024 5, 11, 17, 23, 29
Aug 2024 4, 10, 16, 22, 28
Sep 2024 4, 10, 16, 22, 28
Oct 2024 3, 9, 15, 21, 27
Nov 2024 3, 9, 15, 21, 27
Dec 2024 |
• Tisch TE-5170 (S/N: 3976) |
|
AM2 |
SENTX Site Boundary (West, near DP3) |
• Tisch TE-5170 (S/N: 3573) |
|||
|
AM3 |
SENTX Site Boundary (West, near RC15) |
• Tisch TE-5170 (S/N: 3572) |
|||
|
AM4 |
SENTX Site Boundary (West, near EPD building) |
· Tisch TE-5170 (S/N: 3957) |
The
schedule for dust monitoring during the reporting period is provided in Annex C.
The 24-hour
TSP monitoring results are summarised in Table 2.3.
The detailed monitoring results and the graphical presentation of the 24-hour
TSP monitoring results at each monitoring location are provided in Annex D1.
Table 2.3 Summary of 24-hour TSP Monitoring Results in the
Reporting Period
|
Month |
Monitoring Station |
Average 24-hr TSP Concentration (µg m-3) |
Action Level (µg/m3) |
Limit Level (µg/m3) |
|
|
Average |
Range |
||||
|
January
2024 |
AM1 |
185 |
82 –
301 |
260 |
260 |
|
AM2 |
132 |
77 –
254 |
260 |
260 |
|
|
AM3 |
165 |
147 –
196 |
260 |
260 |
|
|
AM4 |
134 |
81 –
170 |
260 |
260 |
|
|
February
2024 |
AM1 |
59 |
28 – 83 |
260 |
260 |
|
AM2 |
61 |
33 – 84 |
260 |
260 |
|
|
AM3 |
71 |
30 –
102 |
260 |
260 |
|
|
AM4 |
72 |
36– 95 |
260 |
260 |
|
|
March
2024 |
AM1 |
222 |
52 –
354 |
260 |
260 |
|
AM2 |
158 |
47 –
220 |
260 |
260 |
|
|
AM3 |
169 |
93 –
207 |
260 |
260 |
|
|
AM4 |
158 |
134–
178 |
260 |
260 |
|
|
April
2024 |
AM1 |
74 |
43 –
100 |
260 |
260 |
|
AM2 |
82 |
66 –
117 |
260 |
260 |
|
|
AM3 |
79 |
56 – 97 |
260 |
260 |
|
|
AM4 |
65 |
49 – 78 |
260 |
260 |
|
|
May
2024 |
AM1 |
108 |
32 –
241 |
260 |
260 |
|
AM2 |
98 |
41 –
167 |
260 |
260 |
|
|
AM3 |
127 |
28 –
242 |
260 |
260 |
|
|
AM4 |
61 |
28 –
104 |
260 |
260 |
|
|
June
2024 |
AM1 |
39 |
36 – 46 |
260 |
260 |
|
AM2 |
76 |
51 –
139 |
260 |
260 |
|
|
AM3 |
73 |
56 – 96 |
260 |
260 |
|
|
AM4 |
43 |
43 – 60 |
260 |
260 |
|
|
July
2024 |
AM1 |
72 |
20 –
143 |
260 |
260 |
|
AM2 |
60 |
42 – 98 |
260 |
260 |
|
|
AM3 |
125 |
55 –
235 |
260 |
260 |
|
|
AM4 |
83 |
29 –
172 |
260 |
260 |
|
|
August
2024 |
AM1 |
75 |
23 –
107 |
260 |
260 |
|
AM2 |
85 |
27 –
151 |
260 |
260 |
|
|
AM3 |
114 |
30 –
225 |
260 |
260 |
|
|
AM4 |
55 |
20 – 74 |
260 |
260 |
|
|
September
2024 |
AM1 |
85 |
42 –
146 |
260 |
260 |
|
AM2 |
57 |
45 – 95 |
260 |
260 |
|
|
AM3 |
96 |
38 –
211 |
260 |
260 |
|
|
AM4 |
79 |
22 –
113 |
260 |
260 |
|
|
October
2024 |
AM1 |
83 |
41 –
163 |
260 |
260 |
|
AM2 |
76 |
53 –
105 |
260 |
260 |
|
|
AM3 |
135 |
118 –
155 |
260 |
260 |
|
|
AM4 |
122 |
51 –
174 |
260 |
260 |
|
|
November
2024 |
AM1 |
64 |
21 –
145 |
260 |
260 |
|
AM2 |
63 |
30 –
111 |
260 |
260 |
|
|
AM3 |
113 |
31 –
184 |
260 |
260 |
|
|
AM4 |
88 |
25 –
125 |
260 |
260 |
|
|
December
2024 |
AM1 |
127 |
54 –
203 |
260 |
260 |
|
AM2 |
87 |
60 –
169 |
260 |
260 |
|
|
AM3 |
196 |
103 - 241 |
260 |
260 |
|
|
AM4 |
141 |
107 – 182 |
260 |
260 |
|
The major dust sources in the reporting period included fugitive dust emission from the exposed area in
SENTX, as well as nearby operations of the SENT landfill and the TKO Area 137
Fill Bank.
Action and Limit Levels exceedance was recorded for
TSP monitoring in the reporting period and actions in accordance with the Event
and Action Plan presented in Annex D2 were
undertaken. Investigation of the Action and Limit Levels exceedance were conducted and the investigation report is presented in Annex D7.
Based on the investigation conducted for the
monitoring event with potential Limit Levels exceedances with the Contractor
and the IEC, the TSP exceedances at AM1 on 2 and 8 January 2024, 14 and 26
March 2024 were considered non Project-related.
The
Contractor was reminded to implement all relevant mitigation measures for the
construction and operation works and maintain good site practice. The ET
will keep track on the monitoring data and ensure Contractor’s compliance of the
environmental requirements.
Meteorological
data obtained from the SENTX on-site meteorological monitoring station was used
for the dust monitoring and is shown in Annex D3. It is considered that meteorological data
obtained at the on-site meteorological monitoring station is representative of
the Project area and could be used for the operation/restoration phase dust
monitoring programme for the Project.
According
to the updated EM&A Manual of the Project, odour
patrol was carried out along the site boundary during the operation/
restoration phase.
During the
first month of operation, daily odour patrol (3 times
per day) was conducted jointly by the ET and the IEC. The odour
intensity detected was based on that determined by the IEC. In addition, an
independent party (ALS Technichem (HK) Pty Ltd.) was
appointed to undertake odour patrol together with the
ET and IEC three times per week. During
these patrols, the odour intensity detected was based
on that determined by the independent third party.
Reduction of odour
monitoring frequency from Period 1 (daily, three times per day) to Period 2
(weekly) was approved by EPD on 4 February 2022. Weekly odour patrol was conducted jointly by the ET and the IEC
from 10 February 2022. In addition, an independent party (ALS Technichem (HK) Pty Ltd.) was appointed to undertake odour patrol together with the ET and IEC once every two
weeks.
Reduction of odour
monitoring frequency from Period 2 (weekly) to Period 3 (monthly) was approved
by EPD on 2 June 2022. Monthly odour patrol was
conducted jointly by the ET and the IEC from 28 June 2022. In addition,
an independent party (ALS Technichem (HK) Pty Ltd.)
was appointed to undertake odour patrol together with
the ET and IEC quarterly. Furthermore, the odour
patrol route has been reviewed against the latest construction / operation programme and approved by EPD on 17 June 2024.
The Action
and Limit Levels for odour patrol is
provided in Table 2.4 below.
Table 2.4 Action and Limit Levels for Odour Patrol
|
Parameter |
Action Level |
Limit Level |
|
Perceived odour intensity and odour complaints |
· Odour intensity ≥ Class 2 recorded; or · One documented complaint received |
· Odour intensity ≥ Class 3 recorded on 2 consecutive patrol (a) (b)
|
|
Notes: (a) i.e. either Class 3-strong or Class 4-extreme odour intensity. (b) The exceedances of the odour intensity do not need to be recorded at the same location. |
||
Odour
patrol was conducted by trained personnel/competent persons with a specific
sensitivity to a reference odour (i.e. on reference
materials n-butanol with the concentration of 50ppm in nitrogen (v/v)) in
compliance with Section 3.7.2 of the updated EM&A Manual patrolling and
sniffing along the SENTX Site boundary to detect any odour.
The odour monitoring programme and patrol route are summarised
in Table 2.5 and illustrated in Figure 2.2 and Figure 2.3 respectively.
Table 2.5 Odour Monitoring Details
|
Patrol Locations |
Parameters |
Patrol Frequency (a) |
Monitoring Dates |
|
Patrol along the SENTX Site Boundary (Checkpoints OP1 – OP17) |
Odour Intensity (see Table 2.6) |
Period 1 - First month of operation Daily, three times a day in the morning, afternoon and evening/night (between 18:00 and 22:00 hrs) conducted by the ET and the IEC
Three times per week on different days conducted by an independent third party together with the ET and IEC (b)
Period 2 - Three months following period 1 (c)
Weekly conducted by the ET and the IEC
Once every two weeks conducted by an independent third party together with the ET and IEC (b)
Period 3 - Throughout operation following period 2 (c) Monthly conducted by the ET and the IEC
Quarterly conducted by an independent third party together with the ET and IEC (b) |
Conducted by ET & IEC: 12 Jan 2024, 21 Feb 2024, 24 Apr 2024, 21 May 2024, 26 Jul 2024, 1 Aug 2024, 18 Oct 2024, 1 Nov 2024 Conducted by an independent third party, ET &
IEC: 14 Mar 2024, 18 Jun 2024, 20 Sep 2024, 18 Dec 2024 |
|
Notes: (a) Reduction of monitoring frequency will be subject to the monitoring results to demonstrate environmentally acceptable performance. (b) Patrol shall be scheduled so that they are carried out together with the patrols to be carried out jointly by the ET and the IEC. (c) Commencement of each period will be justified by the ET Leader and verified by the IEC and will be subject to agreement with the EPD (EIAO Authority) and Project Proponent. |
|||
Table 2.6 Odour Intensity Level
|
Class |
Odour Intensity |
Description |
|
0 |
Not Detected |
No odour perceived or an odour so weak that it cannot be easily characterised or described. |
|
1 |
Slight |
Identified odour, slight |
|
2 |
Moderate |
Identified odour, moderate |
|
3 |
Strong |
Identified odour, strong |
|
4 |
Extreme |
Severe odour |
The
schedule for odour patrol during the reporting period
is provided in Annex C.
The odour monitoring results are summarised
and provided in Table 2.7 and Annex D4, respectively.
Table 2.7 Summary of Odour Monitoring Results in the
Reporting Period
|
Odour Checkpoints |
Odour Intensity Class |
Action Level |
Limit Level |
|
OP1 |
0 |
Odour intensity ≥ Class 2 recorded |
Odour intensity ≥ Class 3 recorded on 2 consecutive patrol |
|
OP2 |
0 - 1 |
||
|
OP3 |
0 - 1 |
||
|
OP4 |
0 |
||
|
OP5 |
0 |
||
|
OP6 |
0 |
||
|
OP7 |
0 - 1 |
||
|
OP8 |
0 - 1 |
||
|
OP9 |
0 - 1 |
||
|
OP10 |
0 - 1 |
||
|
OP11 |
0 - 1 |
||
|
OP12 |
0 - 1 |
||
|
OP13 |
0 - 1 |
||
|
OP14 |
0 - 1 |
||
|
OP15 |
0 |
||
|
OP16 |
0 |
||
|
OP17 |
0 - 1 |
The potential odour source in the reporting
period included the sediment
trap, Cell 4X tipping area, leachate from Leachate Plant and sewage from sewer at
SENTX, the restoration
work at SENT, as well as the nearby construction site, vegetation
and Towngas plant.
All the odour monitoring results were below
the Action and Limit Levels in the reporting period. No action is thus required
to be undertaken in accordance with the Event and Action Plan presented in Annex D2.
According
to the updated EM&A Manual of the Project, the performance of the thermal oxidiser, landfill gas flare and landfill gas generator was
monitored when they are in operation. Gas samples were collected from the stack
of the thermal oxidizer, landfill gas flare and landfill gas generator for
laboratory analysis for NO2, CO, SO2, Benzene
and Vinyl chloride and in-situ analysis for exhaust gas velocity at monthly
interval and for laboratory analysis for non-methane organic compounds and
ammonia (for thermal oxidizer only) at quarterly interval. The operating conditions of the thermal oxidiser, landfill gas flare and landfill gas generator
were also monitored continuously.
The Limit
Levels for stack emission of the thermal oxidiser,
landfill gas flare and landfill gas generator are provided in Tables 2.8 –
2.10 below.
Table 2.8 Limit Levels for Stack Emission of the Thermal
Oxidiser
|
Parameters |
Limit Level |
|
NO2 |
1.58 gs-1 |
|
CO |
0.53 gs-1 |
|
SO2 |
0.07 gs-1 |
|
Benzene |
3.01 x 10⁻² gs-1 |
|
Vinyl chloride |
2.23 x 10⁻³ gs-1 |
|
Gas combustion temperature |
850oC (minimum) |
|
Exhaust gas exit temperature |
443K (minimum) (a) |
|
Exhaust gas velocity |
7.5 ms-1 (minimum) (a) |
|
Note: (a) Level under full load condition. |
|
Table 2.9 Limit Levels for Stack Emission of the Landfill
Gas Flare
|
Parameters |
Limit Level |
|
NO2 |
0.97 gs-1 |
|
CO |
2.43 gs-1 |
|
SO2 |
0.22 gs-1 |
|
Benzene |
4.14 x 10⁻⁴ gs-1 |
|
Vinyl chloride |
2.60 x 10⁻⁴ gs-1 |
|
Gas combustion temperature |
815oC (minimum) |
|
Exhaust gas exit temperature |
923 K (minimum) (a) |
|
Exhaust gas velocity |
9.0 m s-1 (minimum) (a) |
|
Note: (a) Level under full load condition. |
|
Table 2.10
Limit Levels for Stack Emission of the Landfill Gas Generator
|
Parameters |
Limit Level |
|
NO2 |
1.91 gs-1 |
|
CO |
2.48 gs-1 |
|
SO2 |
0.528 gs-1 |
|
Benzene |
2.47 x 10⁻⁴ gs-1 |
|
Vinyl chloride |
1.88 x 10⁻⁵ gs-1 |
|
Gas combustion temperature |
450oC (minimum) |
|
Exhaust gas exit temperature |
723K (minimum) (a) |
|
Exhaust gas velocity |
30.0 ms-1 (minimum) (a) |
|
Note: (a) Level under full load condition. |
|
Gas samples
were collected from the centroid of the stack with stainless steel sampling
probe, into inert sample containers (i.e. Canister and Tedlar
Bag) and transferred to ALS Technichem (HK) Pty Ltd.
(HOKLAS Registration No. 066) laboratory within 24 hours of collection for
direct analysis on a gas chromatography within 48 hours after collection.
The flue gas velocity of the gas stream at the exhaust of thermal oxidize
was determined by S-Pitot tube during the emission sampling.
The stack
emission monitoring programme and monitoring
locations are summarised in Table 2.11 and
illustrated in Figure 2.1,
respectively.
Table 2.11
Thermal Oxidiser, Landfill Gas Flare and Landfill Gas Generator Stack Emission
Monitoring Details
|
Monitoring Location |
Parameter |
Frequency |
Monitoring Date |
|
Stack of Thermal Oxidiser |
Laboratory analysis for · NO2 · CO · SO2 · Benzene · Vinyl chloride In-situ analysis for · Exhaust gas velocity |
Monthly for the first 12 months of operation and thereafter at quarterly intervals |
11 Jan 2024, 20 Feb 2024, 14 Mar 2024, 19 Apr 2024, 10 May 2024, 26 Jun 2024, 23 Jul 2024, 21 Aug 2024, 23 Sep 2024, 14 Oct 2024, 15 Nov 2024, 18 Dec 2024 |
|
Laboratory analysis for · Non-methane organic compounds CO |
Quarterly for the 1st year of operation (b) |
20 Feb 2024, 10 May 2024, 21 Aug 2024, 15 Nov 2024 |
|
|
Laboratory analysis for · Ammonia · Gas combustion temperature · Exhaust temperature · Exhaust gas velocity (a) |
Quarterly |
20 Feb 2024, 10 May 2024, 21 Aug 2024, 15 Nov 2024 |
|
|
· Gas combustion temperature · Exhaust temperature · Exhaust gas velocity (a) |
Continuously |
1 Jan – 31 Dec 2024 |
|
|
Stack of Landfill Gas Flare |
Laboratory analysis for · NO2 · CO · SO2 · Benzene · Vinyl chloride In-situ analysis for · Exhaust gas velocity |
Monthly for the first 12 months of operation and thereafter at quarterly intervals |
12 Jan 2024, 19 Feb 2024, 15 Mar 2024, 18 Apr 2024, 9 May 2024, 17 Jun 2024, 22 Jul 2024, 20 Aug 2024, 24 Sep 2024, 15 Oct 2024, 18 Nov 2024, 20 Dec 2024 |
|
Laboratory analysis for · Non-methane organic compounds CO |
Quarterly for the 1st year of operation (b) |
19 Feb 2024, 9 May 2024, 20 Aug 2024, 18 Nov 2024 |
|
Monitoring Location |
Parameter |
Frequency |
Monitoring Date |
|
Stack of Landfill Gas Flare |
· Gas combustion temperature · Exhaust temperature · Exhaust gas velocity (a) |
Continuously |
1 Jan –
31 Dec 2024 |
|
Stack of Landfill Gas Generator |
Laboratory analysis for · NO2 · CO · SO2 · Benzene · Vinyl chloride In-situ analysis for · Exhaust gas velocity |
Monthly for the first 12 months of operation and thereafter at quarterly intervals |
12 Jan 2024, 19 Feb 2024, 15 Mar 2024, 18 Apr 2024, 9 May 2024, 17 Jun 2024, 22 Jul 2024, 20 Aug 2024, 23 Sep 2024, 15 Oct 2024, 15 Nov 2024, 20 Dec 2024 |
|
Laboratory analysis for · Non-methane organic compounds |
Quarterly for the 1st year of operation (b) |
19 Feb
2024, 9 May
2024, 20 Aug
2024, 15 Nov
2024 |
|
|
· Exhaust temperature · Exhaust gas velocity (a) |
Continuously |
1 Jan –
31 Dec 2024 |
|
|
Notes: (a) The exhaust gas velocity is calculated based on the cross-section area of the stack and continuous monitored gas flow and combustion temperature data. (b) The monitoring results are being reviewed to determine if monitoring of this parameter can be terminated upon agreement by the EIAO Authority, IEC and Project Proponent. |
|||
The
schedule for thermal oxidizer, landfill gas flare and landfill gas generator
stack emission monitoring during the reporting period is provided in Annex C.
The thermal
oxidizer, landfill gas flare and landfill gas generator stack emission
monitoring results and detailed continuous monitoring results are summarised in Tables 2.12 - 2.14 and provided in Annex D5, respectively.
Table 2.12
Summary of Thermal Oxidiser Stack Emission Monitoring in the Reporting Period
|
Parameters |
Monitoring Results (Range in Bracket) |
Limit Level |
|
January 2024 |
||
|
NO2 |
0.71 gs-1 |
1.58 gs-1 |
|
CO |
0.03 gs-1 |
0.53 gs-1 |
|
SO2 |
<0.01
gs-1 |
0.07 gs-1 |
|
Benzene |
<2.0
x 10-4 gs-1 |
3.01 x 10⁻² gs-1 |
|
Vinyl chloride |
<1.5
x 10-4 gs-1 |
2.23 x 10⁻³ gs-1 |
|
Gas combustion temperature |
926oC
(923oC – 930oC) |
850oC (minimum) |
|
Exhaust gas exit temperature |
1,197K (1,184K
– 1,214K) |
443K (minimum) (a) |
|
Exhaust gas velocity |
10.2 ms-1
(b) |
7.5 ms-1 (minimum) (a) |
|
February 2024 |
||
|
NO2 |
1.04 gs-1 |
1.58 gs-1 |
|
CO |
0.02 gs-1 |
0.53 gs-1 |
|
SO2 |
<0.01
gs-1 |
0.07 gs-1 |
|
Non-Methane Organic Carbons |
<1.0
x 10-4 gs-1 |
- |
|
Benzene |
<9.0
x 10-5 gs-1 |
3.01 x 10⁻² gs-1 |
|
Vinyl chloride |
0.003
gs-1 |
2.23 x 10⁻³ gs-1 |
|
Ammonia |
0.0341
gs-1 |
-(c) |
|
Gas combustion temperature |
925oC
(911oC – 930oC) |
850oC (minimum) |
|
Exhaust gas exit temperature |
1,213K
(1,208K – 1,223K) |
443K (minimum) (a) |
|
Exhaust gas velocity |
8.3 ms-1
(b) |
7.5 ms-1 (minimum) (a) |
|
March 2024 |
||
|
NO2 |
0.03 gs-1 |
1.58 gs-1 |
|
CO |
0.02 gs-1 |
0.53 gs-1 |
|
SO2 |
<0.004 gs-1 |
0.07 gs-1 |
|
Benzene |
<2.0
x 10-4 gs-1 |
3.01 x 10⁻² gs-1 |
|
Vinyl chloride |
<9.0
x 10-5 gs-1 |
2.23 x 10⁻³ gs-1 |
|
Gas combustion temperature |
925oC
(921oC – 928oC) |
850oC (minimum) |
|
Exhaust gas exit temperature |
1,224K
(1,214K – 1,231K) |
443K (minimum) (a) |
|
Exhaust gas velocity |
9.2 ms-1
(b) |
7.5 ms-1 (minimum) (a) |
|
April 2024 |
||
|
NO2 |
1.58 gs-1 |
1.58 gs-1 |
|
CO |
0.02 gs-1 |
0.53 gs-1 |
|
SO2 |
0.01 gs-1 |
0.07 gs-1 |
|
Benzene |
<1.0
x 10-4 gs-1 |
3.01 x 10⁻² gs-1 |
|
Vinyl chloride |
<1.0
x 10-4 gs-1 |
2.23 x 10⁻³ gs-1 |
|
Gas combustion temperature |
907oC
(896oC – 927oC) |
850oC (minimum) |
|
Exhaust gas exit temperature |
1,225K
(1,214K – 1,234K) |
443K (minimum) (a) |
|
Exhaust gas velocity |
8.4 ms-1
(b) |
7.5 ms-1 (minimum) (a) |
|
May 2024 |
||
|
NO2 |
1.18 gs-1 |
1.58 gs-1 |
|
CO |
0.03 gs-1 |
0.53 gs-1 |
|
SO2 |
0.01 gs-1 |
0.07 gs-1 |
|
Benzene |
<2.0
x 10-4 gs-1 |
3.01 x 10⁻² gs-1 |
|
Vinyl chloride |
<1.3
x 10-4 gs-1 |
2.23 x 10⁻³ gs-1 |
|
Non-Methane Organic Carbons |
<0.003
gs-1 |
- |
|
Ammonia |
0.0232
gs-1 |
-(c) |
|
Gas combustion temperature |
900oC
(894oC – 907oC) |
850oC (minimum) |
|
Exhaust gas exit temperature |
1,225K
(1,213K – 1,232K) |
443K (minimum) (a) |
|
Exhaust gas velocity |
9.3 ms-1
(b) |
7.5 ms-1 (minimum) (a) |
|
June 2024 |
||
|
NO2 |
0.90 gs-1 |
1.58 gs-1 |
|
CO |
0.02 gs-1 |
0.53 gs-1 |
|
SO2 |
<0.01
gs-1 |
0.07 gs-1 |
|
Benzene |
<2.0
x 10-4 gs-1 |
3.01 x 10⁻² gs-1 |
|
Vinyl chloride |
<1.2
x 10-4 gs-1 |
2.23 x 10⁻³ gs-1 |
|
Gas combustion temperature |
900oC
(897oC – 907oC) |
850oC (minimum) |
|
Exhaust gas exit temperature |
1,217K
(1,210K – 1,225K) |
443K (minimum) (a) |
|
Exhaust gas velocity |
10.0 ms-1
(b) |
7.5 ms-1 (minimum) (a) |
|
July 2024 |
||
|
NO2 |
1.12 gs-1 |
1.58 gs-1 |
|
CO |
0.02 gs-1 |
0.53 gs-1 |
|
SO2 |
<0.01
gs-1 |
0.07 gs-1 |
|
Benzene |
<2.0
x 10-4 gs-1 |
3.01 x 10⁻² gs-1 |
|
Vinyl chloride |
<1.4
x 10-4 gs-1 |
2.23 x 10⁻³ gs-1 |
|
Gas combustion temperature |
901oC
(895oC – 913oC) |
850oC (minimum) |
|
Exhaust gas exit temperature |
1,212K
(1,202K – 1,219K) |
443K (minimum) (a) |
|
Exhaust gas velocity |
11.0 ms-1
(b) |
7.5 ms-1 (minimum) (a) |
|
August 2024 |
||
|
NO2 |
0.57 gs-1 |
1.58 gs-1 |
|
CO |
0.03 gs-1 |
0.53 gs-1 |
|
SO2 |
<0.01
gs-1 |
0.07 gs-1 |
|
Benzene |
<2.0
x 10-4 gs-1 |
3.01 x 10⁻² gs-1 |
|
Vinyl chloride |
<1.3
x 10-4 gs-1 |
2.23 x 10⁻³ gs-1 |
|
Non-Methane Organic Carbon |
<0.003
gs-1 |
- |
|
Ammonia |
0.0315
gs-1 |
- (c) |
|
Gas combustion temperature |
900oC
(895oC – 904oC) |
850oC (minimum) |
|
Exhaust gas exit temperature |
1,206K
(1,200K – 1,214K) |
443K (minimum) (a) |
|
Exhaust gas velocity |
9.4 ms-1
(b) |
7.5 ms-1 (minimum) (a) |
|
September 2024 |
||
|
NO2 |
0.67 gs-1 |
1.58 gs-1 |
|
CO |
0.02 gs-1 |
0.53 gs-1 |
|
SO2 |
<0.01
gs-1 |
0.07 gs-1 |
|
Benzene |
3.0 x
10-4 gs-1 |
3.01 x 10⁻² gs-1 |
|
Vinyl chloride |
<1.2
x 10-4 gs-1 |
2.23 x 10⁻³ gs-1 |
|
Gas combustion temperature |
899oC
(893oC – 908oC) |
850oC (minimum) |
|
Exhaust gas exit temperature |
1,198K
(1,188K – 1,205K) |
443K (minimum) (a) |
|
Exhaust gas velocity |
9.6 ms-1
(b) |
7.5 ms-1 (minimum) (a) |
|
October 2024 |
||
|
NO2 |
1.07 gs-1 |
1.58 gs-1 |
|
CO |
0.02 gs-1 |
0.53 gs-1 |
|
SO2 |
<0.01
gs-1 |
0.07 gs-1 |
|
Benzene |
3.0 x
10-4 gs-1 |
3.01 x 10⁻² gs-1 |
|
Vinyl chloride |
<1.3
x 10-4 gs-1 |
2.23 x 10⁻³ gs-1 |
|
Gas combustion temperature |
901oC
(893oC – 906oC) |
850oC (minimum) |
|
Exhaust gas exit temperature |
1,198K (1,160K
– 1,204K) |
443K (minimum) (a) |
|
Exhaust gas velocity |
9.2 ms-1
(b) |
7.5 ms-1 (minimum) (a) |
|
November 2024 |
||
|
NO2 |
1.03 gs-1 |
1.58 gs-1 |
|
CO |
0.02 gs-1 |
0.53 gs-1 |
|
SO2 |
<0.01
gs-1 |
0.07 gs-1 |
|
Benzene |
<2.0
x 10-4 gs-1 |
3.01 x 10⁻² gs-1 |
|
Vinyl chloride |
<1.1
x 10-4 gs-1 |
2.23 x 10⁻³ gs-1 |
|
Non-Methane Organic Carbon |
<0.002
gs-1 |
- |
|
Ammonia |
0.0278
gs-1 |
- (c) |
|
Gas combustion temperature |
901oC
(896oC – 915oC) |
850oC (minimum) |
|
Exhaust gas exit temperature |
1,193K
(1,179K – 1,201K) |
443K (minimum) (a) |
|
Exhaust gas velocity |
8.5 ms-1
(b) |
7.5 ms-1 (minimum) (a) |
|
December 2024 |
||
|
NO2 |
0.97 gs-1 |
1.58 gs-1 |
|
CO |
0.03 gs-1 |
0.53 gs-1 |
|
SO2 |
<0.01
gs-1 |
0.07 gs-1 |
|
Benzene |
<2.0
x 10-4 gs-1 |
3.01 x 10⁻² gs-1 |
|
Vinyl chloride |
<1.6
x 10-4 gs-1 |
2.23 x 10⁻³ gs-1 |
|
Gas combustion temperature |
902oC
(897oC – 916oC) |
850oC (minimum) |
|
Exhaust gas exit temperature |
1,190K
(1,169K – 1,200K) |
443K (minimum) (a) |
|
Exhaust gas velocity |
8.1 ms-1
(b) |
7.5 ms-1 (minimum) (a) |
|
Notes: (a) Level under full load condition. (b) The exhaust gas velocity was calculated based on the cross-section area of the stack and the gas flow and combustion temperature data measured during the stack emission monitoring. (c) The emission limit for ammonia is under review and will be supplemented in subsequent revision. |
||
Table 2.13
Summary of Landfill Gas Flare Stack Emission Monitoring in the Reporting Period
|
Parameters |
Monitoring Results (Range in Bracket) |
Limit Level |
|
|
January 2024 |
|
||
|
NO2 |
0.04 gs-1 |
0.97 gs-1 |
|
|
CO |
0.03 gs-1 |
2.43 gs-1 |
|
|
SO2 |
0.086
gs-1 |
0.22 gs-1 |
|
|
Benzene |
<1.37
x 10-4 gs-1 |
4.14 x 10⁻⁴ gs-1 |
|
|
Vinyl chloride |
<1.1
x 10-4 gs-1 |
2.60 x 10⁻⁴ gs-1 |
|
|
Gas combustion temperature |
Flare 1: 887oC (836oC – 981oC) Flare 2: 938oC
(864oC – 996oC) |
815oC (minimum) |
|
|
Exhaust gas exit temperature |
Flare
1: 1,148K (1,077K – 1,258K) Flare 2: 1,162K (1,052K – 1,233K) |
923 K (minimum) (a) |
|
|
Exhaust gas velocity |
10.0 ms-1
(b) |
9.0 m s-1 (minimum) (a) |
|
|
February 2024 |
|
||
|
NO2 |
<0.02
gs-1 |
0.97 gs-1 |
|
|
CO |
0.02 gs-1 |
2.43 gs-1 |
|
|
SO2 |
<0.01
gs-1 |
0.22 gs-1 |
|
|
Non-Methane Organic Carbons |
<1.27
x 10-4 gs-1 |
- |
|
|
Benzene |
<1.02
x 10-4 gs-1 |
4.14 x 10⁻⁴ gs-1 |
|
|
Vinyl chloride |
0.003
gs-1 |
2.60 x 10⁻⁴ gs-1 |
|
|
Gas combustion temperature |
Flare 1: 895oC (860oC – 930oC) Flare 2: 950oC
(920oC – 980oC) |
815oC (minimum) |
|
|
Exhaust gas exit temperature |
Flare
1: 1,124K (1,075K – 1,184K) Flare
2: 1,193K (1,155K – 1,233K) |
923 K (minimum) (a) |
|
|
Exhaust gas velocity |
8.9 ms-1
(b) |
9.0 m s-1 (minimum) (a) |
|
|
March 2024 |
|
||
|
NO2 |
0.04 gs-1 |
0.97 gs-1 |
|
|
CO |
0.04 gs-1 |
2.43 gs-1 |
|
|
SO2 |
0.005
gs-1 |
0.22 gs-1 |
|
|
Benzene |
<1.26
x 10-4 gs-1 |
4.14 x 10⁻⁴ gs-1 |
|
|
Vinyl chloride |
<1.01
x 10-4 gs-1 |
2.60 x 10⁻⁴ gs-1 |
|
|
Gas combustion temperature |
Flare 1: 856oC (820oC – 880oC) Flare 2: 846oC (830oC – 880oC) |
815oC (minimum) |
|
|
Exhaust gas exit temperature |
Flare
1: 1,096K (1,063K – 1,113K) Flare
2: 1,076K (1,053K – 1,103K) |
923 K (minimum) (a) |
|
|
Exhaust gas velocity |
7.2 ms-1
(b) |
9.0 m s-1 (minimum) (a) |
|
|
April 2024 |
|
||
|
NO2 |
0.03 gs-1 |
0.97 gs-1 |
|
|
CO |
2.61 gs-1 |
2.43 gs-1 |
|
|
SO2 |
0.08 gs-1 |
0.22 gs-1 |
|
|
Benzene |
6.479 x
10-3 gs-1 |
4.14 x 10⁻⁴ gs-1 |
|
|
Vinyl chloride |
<1.14
x 10-4 gs-1 |
2.60 x 10⁻⁴ gs-1 |
|
|
Gas combustion temperature |
Flare 1: 862oC (821oC –
892oC) Flare 2: 894oC
(854oC – 934oC) |
815oC (minimum) |
|
|
Exhaust gas exit temperature |
Flare 1: 1,121K (1,082K – 1,158K) Flare 2: 1,150K (1,106K – 1,187K) |
923 K (minimum) (a) |
|
|
Exhaust gas velocity |
9.8 ms-1
(b) |
9.0 m s-1 (minimum) (a) |
|
|
May 2024 |
|
||
|
NO2 |
0.02 gs-1 |
0.97 gs-1 |
|
|
CO |
0.02 gs-1 |
2.43 gs-1 |
|
|
SO2 |
0.06 gs-1 |
0.22 gs-1 |
|
|
Benzene |
6.73 x
10-4 gs-1 |
4.14 x 10⁻⁴ gs-1 |
|
|
Vinyl chloride |
<1.01
x 10-4 gs-1 |
2.60 x 10⁻⁴ gs-1 |
|
|
Non-Methane Organic Carbon |
<0.002
gs-1 |
- |
|
|
Gas combustion temperature |
Flare 1: 867oC (826oC –
898oC) Flare 2: 896oC
(856oC – 936oC) |
815oC
(minimum) |
|
|
Exhaust gas exit temperature |
Flare 1: 1,126K (1,087K – 1,159K) Flare 2: 1,152K
(1,109K – 1,189K) |
923 K
(minimum) (a) |
|
|
Exhaust gas velocity |
8.9 ms-1
(b) |
9.0 m s-1 (minimum) (a) |
|
|
June 2024 |
|
||
|
NO2 |
0.02 gs-1 |
0.97 gs-1 |
|
|
CO |
0.02 gs-1 |
2.43 gs-1 |
|
|
SO2 |
0.05 gs-1 |
0.22 gs-1 |
|
|
Benzene |
<1.21
x 10-4 gs-1 |
4.14 x 10⁻⁴ gs-1 |
|
|
Vinyl chloride |
<9.7
x 10-5 gs-1 |
2.60 x 10⁻⁴ gs-1 |
|
|
Gas combustion temperature |
Flare 1: 874oC (836oC –
907oC) Flare 2: 901oC (856oC – 951oC) |
815oC (minimum) |
|
|
Exhaust gas exit temperature |
Flare 1: 1,139K (1,102K – 1,173K) Flare
2: 1,167K (1,124K – 1,214K) |
923 K (minimum) (a) |
|
|
Exhaust gas velocity |
9.1 ms-1
(b) |
9.0 m s-1 (minimum) (a) |
|
|
July 2024 |
|
||
|
NO2 |
0.01 gs-1 |
0.97 gs-1 |
|
|
CO |
0.04 gs-1 |
2.43 gs-1 |
|
|
SO2 |
0.02 gs-1 |
0.22 gs-1 |
|
|
Benzene |
<6.0
x 10-5 gs-1 |
4.14 x 10⁻⁴ gs-1 |
|
|
Vinyl chloride |
<4.8
x 10-5 gs-1 |
2.60 x 10⁻⁴ gs-1 |
|
|
Gas combustion temperature |
Flare 1: 876oC (831oC – 916oC) Flare 2: 901oC (853oC – 951oC) |
815oC (minimum) |
|
|
Exhaust gas exit temperature |
Flare
1: 1,140K (1,099K – 1,171K) Flare
2: 1,164K (1,115K – 1,222K) |
923 K (minimum) (a) |
|
|
Exhaust gas velocity |
4.3 ms-1
(b) |
9.0 m s-1 (minimum) (a) |
|
|
August 2024 |
|
||
|
NO2 |
<0.02
gs-1 |
0.97 gs-1 |
|
|
CO |
0.02 gs-1 |
2.43 gs-1 |
|
|
SO2 |
0.01 gs-1 |
0.22 gs-1 |
|
|
Benzene |
<1.17
x 10-4 gs-1 |
4.14 x 10⁻⁴ gs-1 |
|
|
Vinyl chloride |
<9.4
x 10-5 gs-1 |
2.60 x 10⁻⁴ gs-1 |
|
|
Non-Methane Organic Carbon |
<0.002
gs-1 |
- |
|
|
Gas combustion temperature |
Flare 1: 866oC (840oC – 890oC) Flare 2: 896oC (865oC – 928oC) |
815oC (minimum) |
|
|
Exhaust gas exit temperature |
Flare
1: 1,124K (1,096K – 1,151K) Flare
2: 1,154K (1,126K – 1,190K) |
923 K (minimum) (a) |
|
|
Exhaust gas velocity |
9.0 ms-1
(b) |
9.0 m s-1 (minimum) (a) |
|
|
September 2024 |
|
||
|
NO2 |
0.01 gs-1 |
0.97 gs-1 |
|
|
CO |
0.04 gs-1 |
2.43 gs-1 |
|
|
SO2 |
<0.01
gs-1 |
0.22 gs-1 |
|
|
Benzene |
<0.94
x 10-5 gs-1 |
4.14 x 10⁻⁴ gs-1 |
|
|
Vinyl chloride |
<7.5
x 10-5 gs-1 |
2.60 x 10⁻⁴ gs-1 |
|
|
Gas combustion temperature |
Flare 1: 852oC (824oC – 887oC) Flare 2: 890oC (857oC – 929oC) |
815oC (minimum) |
|
|
Exhaust gas exit temperature |
Flare
1: 1,114K (1,090K – 1,151K) Flare
2: 1,153K (1,122K – 1,195K) |
923 K (minimum) (a) |
|
|
Exhaust gas velocity |
5.9 ms-1
(b) |
9.0 m s-1 (minimum) (a) |
|
|
October 2024 |
|
||
|
NO2 |
0.02 gs-1 |
0.97 gs-1 |
|
|
CO |
0.04 gs-1 |
2.43 gs-1 |
|
|
SO2 |
0.04 gs-1 |
0.22 gs-1 |
|
|
Benzene |
<1.28
x 10-4 gs-1 |
4.14 x 10⁻⁴ gs-1 |
|
|
Vinyl chloride |
<1.02
x 10-4 gs-1 |
2.60 x 10⁻⁴ gs-1 |
|
|
Gas combustion temperature |
Flare 1: 852oC (826oC – 886oC) Flare 2: 881oC
(849oC – 924oC) |
815oC (minimum) |
|
|
Exhaust gas exit temperature |
Flare
1: 1,120K (1,094K – 1,222K) Flare 2: 1,147K (1,115K – 1,190K) |
923 K (minimum) (a) |
|
|
Exhaust gas velocity |
8.5 ms-1
(b) |
9.0 m s-1 (minimum) (a) |
|
|
November 2024 |
|||
|
NO2 |
0.07 gs-1 |
0.97 gs-1 |
|
|
CO |
1.95 gs-1 |
2.43 gs-1 |
|
|
SO2 |
<0.01
gs-1 |
0.22 gs-1 |
|
|
Benzene |
<1.39
x 10-4 gs-1 |
4.14 x 10⁻⁴ gs-1 |
|
|
Vinyl chloride |
<1.1
x 10-4 gs-1 |
2.60 x 10⁻⁴ gs-1 |
|
|
Non-Methane Organic Carbon |
0.01 gs-1 |
- |
|
|
Gas combustion temperature |
Flare 1: 854oC (824oC – 881oC) Flare 2: 885oC (858oC – 924oC) |
815oC (minimum) |
|
|
Exhaust gas exit temperature |
Flare
1: 1,110K (1,081K – 1,137K) Flare
2: 1,139K (1,115K – 1,179K) |
923 K (minimum) (a) |
|
|
Exhaust gas velocity |
8.2 ms-1
(b) |
9.0 m s-1 (minimum) (a) |
|
|
December 2024 |
|||
|
NO2 |
0.02 gs-1 |
0.97 gs-1 |
|
|
CO |
0.02 gs-1 |
2.43 gs-1 |
|
|
SO2 |
0.05 gs-1 |
0.22 gs-1 |
|
|
Benzene |
1.68 x
10-4 gs-1 |
4.14 x 10⁻⁴ gs-1 |
|
|
Vinyl chloride |
<1.07
x 10-4 gs-1 |
2.60 x 10⁻⁴ gs-1 |
|
|
Gas combustion temperature |
Flare 1: 853oC (822oC – 882oC) Flare 2: 879oC (842oC – 907oC) |
815oC (minimum) |
|
|
Exhaust gas exit temperature |
Flare
1: 1,111K (1,079K – 1,141K) Flare
2: 1,139K (1,105K – 1,169K) |
923 K (minimum) (a) |
|
|
Exhaust gas velocity |
8.4 ms-1 (b) |
9.0 m s-1 (minimum) (a) |
|
|
Note: (a) Level under full load condition. (b) The exhaust gas velocity was calculated based on the cross-section area of the stack and the gas flow and combustion temperature data measured during the stack emission monitoring. |
|||
Table 2.14
Summary of Landfill Gas Generator Stack Emission Monitoring in the Reporting
Period
|
Parameters |
Monitoring Results (Range in Bracket) |
Limit Level |
|
January 2024 |
||
|
NO2 |
0.071
gs-1 |
1.91 gs-1 |
|
CO |
1.06 gs-1 |
2.48 gs-1 |
|
SO2 |
<5.00
x 10-4 gs-1 |
0.528 gs-1 |
|
Benzene |
8.7 x
10-5 gs-1 |
2.47 x 10⁻⁴ gs-1 |
|
Vinyl chloride |
<1.1
x 10-5 gs-1 |
1.88 x 10⁻⁵ gs-1 |
|
Exhaust gas exit temperature |
ENGA:
880K (873K – 889K) ENGB: 855K (844K – 866K) |
723K (minimum) (a) |
|
Exhaust gas velocity |
11.6 ms-1 (b) |
30.0 ms-1 (minimum) (a) |
|
February 2024 |
||
|
NO2 |
0.014
gs-1 |
1.91 gs-1 |
|
CO |
0.963
gs-1 |
2.48 gs-1 |
|
SO2 |
<0.001 gs-1 |
0.528 gs-1 |
|
Non-Methane Organic Carbons |
1.2 x
10-4 gs-1 |
- |
|
Benzene |
<8.8
x 10-6 gs-1 |
2.47 x 10⁻⁴ gs-1 |
|
Vinyl chloride |
5.2 x
10-3 gs-1 |
1.88 x 10⁻⁵ gs-1 |
|
Exhaust gas exit temperature |
ENGA:
874K (857K – 900K) ENGB:
855K (844K – 866K) |
723K (minimum) (a) |
|
Exhaust gas velocity |
10.8 ms-1 (b) |
30.0 ms-1 (minimum) (a) |
|
March 2024 |
||
|
NO2 |
0.058
gs-1 |
1.91 gs-1 |
|
CO |
0.760
gs-1 |
2.48 gs-1 |
|
SO2 |
<0.001 gs-1 |
0.528 gs-1 |
|
Benzene |
7.1 x
10-5 gs-1 |
2.47 x 10⁻⁴ gs-1 |
|
Vinyl chloride |
<1.04
x 10-5 gs-1 |
1.88 x 10⁻⁵ gs-1 |
|
Exhaust gas exit temperature |
ENGA:
848K (833K – 875K) ENGB:
849K (843K – 853K) |
723K (minimum) (a) |
|
Exhaust gas velocity |
10.0 ms-1 (b) |
30.0 ms-1 (minimum) (a) |
|
April 2024 |
||
|
NO2 |
0.101
gs-1 |
1.91 gs-1 |
|
CO |
1.193
gs-1 |
2.48 gs-1 |
|
SO2 |
<0.001 gs-1 |
0.528 gs-1 |
|
Benzene |
1.3 x
10-4 gs-1 |
2.47 x 10⁻⁴ gs-1 |
|
Vinyl chloride |
<1.07
x 10-5 gs-1 |
1.88 x 10⁻⁵ gs-1 |
|
Exhaust gas exit temperature |
ENGA: 863K (848K – 892K) ENGB: 861K (836K – 881K) |
723K (minimum) (a) |
|
Exhaust gas velocity |
9.7 ms-1 (b) |
30.0 ms-1 (minimum) (a) |
|
May 2024 |
||
|
NO2 |
0.084
gs-1 |
1.91 gs-1 |
|
CO |
0.808
gs-1 |
2.48 gs-1 |
|
SO2 |
<0.001 gs-1 |
0.528 gs-1 |
|
Benzene |
5.6 x
10-5 gs-1 |
2.47 x 10⁻⁴ gs-1 |
|
Vinyl chloride |
<1.04
x 10-5 gs-1 |
1.88 x 10⁻⁵ gs-1 |
|
Non-Methane Organic Carbons |
0.0037 gs-1 |
- |
|
Exhaust gas exit temperature |
ENGA: 868K (849K – 882K) ENGB: 866K (847K – 873K) |
723K (minimum) (a) |
|
Exhaust gas velocity |
10.0 ms-1 (b) |
30.0 ms-1 (minimum) (a) |
|
June 2024 |
||
|
NO2 |
0.043
gs-1 |
1.91 gs-1 |
|
CO |
0.711
gs-1 |
2.48 gs-1 |
|
SO2 |
<0.001 gs-1 |
0.528 gs-1 |
|
Benzene |
5.5 x
10-5 gs-1 |
2.47 x 10⁻⁴ gs-1 |
|
Vinyl chloride |
<9.6
x 10-6 gs-1 |
1.88 x 10⁻⁵ gs-1 |
|
Exhaust gas exit temperature |
ENGA: 858K (846K – 884K) ENGB: 860K (847K – 874K) |
723K (minimum) (a) |
|
Exhaust gas velocity |
10.2 ms-1 (b) |
30.0 ms-1 (minimum) (a) |
|
July 2024 |
||
|
NO2 |
0.074
gs-1 |
1.91 gs-1 |
|
CO |
0.742
gs-1 |
2.48 gs-1 |
|
SO2 |
<0.001 gs-1 |
0.528 gs-1 |
|
Benzene |
3.0 x
10-5 gs-1 |
2.47 x 10⁻⁴ gs-1 |
|
Vinyl chloride |
<1.03
x 10-5 gs-1 |
1.88 x 10⁻⁵ gs-1 |
|
Exhaust gas exit temperature |
ENGA:
855K (841K – 891K) ENGB:
868K (850K – 874K) |
723K (minimum) (a) |
|
Exhaust gas velocity |
10.2 ms-1 (b) |
30.0 ms-1 (minimum) (a) |
|
August 2024 |
||
|
NO2 |
0.018
gs-1 |
1.91 gs-1 |
|
CO |
0.715
gs-1 |
2.48 gs-1 |
|
SO2 |
0.002 gs-1 |
0.528 gs-1 |
|
Benzene |
3.7 x
10-5 gs-1 |
2.47 x 10⁻⁴ gs-1 |
|
Vinyl chloride |
<8.9
x 10-6 gs-1 |
1.88 x 10⁻⁵ gs-1 |
|
Non-Methane Organic Carbons |
0.0023
gs-1 |
- |
|
Exhaust gas exit temperature |
ENGA:
868K (844K – 886K) ENGB:
866K (837K – 875K) |
723K (minimum) (a) |
|
Exhaust gas velocity |
8.8 ms-1 (b) |
30.0 ms-1 (minimum) (a) |
|
September 2024 |
||
|
NO2 |
0.039
gs-1 |
1.91 gs-1 |
|
CO |
0.740
gs-1 |
2.48 gs-1 |
|
SO2 |
<0.001 gs-1 |
0.528 gs-1 |
|
Benzene |
5.9 x
10-5 gs-1 |
2.47 x 10⁻⁴ gs-1 |
|
Vinyl chloride |
<8.2
x 10-6 gs-1 |
1.88 x 10⁻⁵ gs-1 |
|
Exhaust gas exit temperature |
ENGA:
849K (838K – 884K) ENGB:
845K (838K – 884K) |
723K (minimum) (a) |
|
Exhaust gas velocity |
9.0 ms-1 (b) |
30.0 ms-1 (minimum) (a) |
|
October 2024 |
||
|
NO2 |
0.037
gs-1 |
1.91 gs-1 |
|
CO |
0.824
gs-1 |
2.48 gs-1 |
|
SO2 |
<0.001 gs-1 |
0.528 gs-1 |
|
Benzene |
9.3 x
10-5 gs-1 |
2.47 x 10⁻⁴ gs-1 |
|
Vinyl chloride |
<8.7
x 10-6 gs-1 |
1.88 x 10⁻⁵ gs-1 |
|
Exhaust gas exit temperature |
ENGA:
856K (839K – 885K) ENGB: 860K (832K – 871K) |
723K (minimum) (a) |
|
Exhaust gas velocity |
10.9 ms-1 (b) |
30.0 ms-1 (minimum) (a) |
|
November 2024 |
||
|
NO2 |
0.093
gs-1 |
1.91 gs-1 |
|
CO |
1.013
gs-1 |
2.48 gs-1 |
|
SO2 |
<0.001 gs-1 |
0.528 gs-1 |
|
Benzene |
1.11 x
10-4 gs-1 |
2.47 x 10⁻⁴ gs-1 |
|
Vinyl chloride |
<1.11
x 10-5 gs-1 |
1.88 x 10⁻⁵ gs-1 |
|
Non-Methane Organic Carbons |
0.0056
gs-1 |
- |
|
Exhaust gas exit temperature |
ENGA:
880K (876K – 883K) ENGB:
876K (860K – 901K) |
723K (minimum) (a) |
|
Exhaust gas velocity |
11.7 ms-1 (b) |
30.0 ms-1 (minimum) (a) |
|
December 2024 |
||
|
NO2 |
0.063
gs-1 |
1.91 gs-1 |
|
CO |
0.77 gs-1 |
2.48 gs-1 |
|
SO2 |
<0.001 gs-1 |
0.528 gs-1 |
|
Benzene |
4.8 x
10-5 gs-1 |
2.47 x 10⁻⁴ gs-1 |
|
Vinyl chloride |
<8.6
x 10-6 gs-1 |
1.88 x 10⁻⁵ gs-1 |
|
Exhaust gas exit temperature |
ENGA:
- (c) ENGB:
866K (860K – 879K) |
723K (minimum) (a) |
|
Exhaust gas velocity |
8.8 ms-1 (b) |
30.0 ms-1 (minimum) (a) |
|
Notes: (a) Level under full load condition. (b) The exhaust gas velocity was calculated based on the cross-section area of the stack and the gas flow and combustion temperature data measured during the stack emission monitoring. |
||
Limit Levels exceedances were
recorded for thermal oxidizer stack emission (SO2) and landfill gas
flare stack emission (Benzene) in the reporting period and actions in
accordance with the Event and Action Plan presented in Annex D2 were undertaken.
Investigation of the Limit Levels exceedances were conducted
and the investigation reports are presented in Annex D7.
Based on
the investigation conducted for the monitoring event with potential Limit
Levels exceedances with the Contractor and the IEC, the landfill gas flare
stack emission (Benzene and CO) exceedances on 18 April 2024 and the landfill
gas flare stack emission (Benzene) exceedance on 9 May 2024 were considered
Project-related.
The
Contractor was reminded to implement all relevant mitigation measures for the
construction and operation works and maintain good site practice. The ET will
keep track of the monitoring data and ensure the Contractor’s compliance of the environmental requirements.
According
to the updated EM&A Manual of the Project, ambient VOCs, ammonia and H2S
monitoring was carried out at the four designated locations along the site
boundary (i.e. AM1, AM2, AM3 and AM4) during the operation/restoration phase,
at quarterly interval.
The Limit
Levels for ambient VOCs, ammonia and H2S monitoring is provided in Table 2.15 below.
Table 2.15
limit levels for ambient vocs, ammonia and h2s monitoirng
|
Parameters |
Limit Level (µg m-³) |
|
Methane |
NA (a) |
|
Ammonia |
180 |
|
H2S |
42 |
|
Dichlorodifluoro-methane |
NA (a) |
|
Vinyl Chloride |
26 |
|
Methanol |
2,660 |
|
Ethanol |
19,200 |
|
Dimethylsulphide |
8 |
|
Carbon Disulphide |
150 |
|
Methylene Chloride |
3,530 |
|
Chloroform |
99 |
|
Methyl propionate |
353 |
|
Butan-2-ol |
667 |
|
1.1.1-Trichloroethane |
5,550 |
|
1.2-Dichloroethane |
210 |
|
Benzene |
33 |
|
Carbon Tetrachloride |
64 |
|
Dipropyl ether |
NA (a) |
|
Heptane |
2,746 |
|
Trichloroethylene |
5,500 |
|
Ethyl propionate |
29 |
|
Methyl butanoate |
30 |
|
Methanethiol |
10 |
|
Toluene |
1,244 |
|
Ethyl butanoate |
71 |
|
Propyl benzene |
19 |
|
Octane |
7,942 |
|
Propyl propionate |
276 |
|
1.2-Dibromoethane (EDB) |
39 |
|
Butyl acetate |
7,240 |
|
Tetrachloroethylene |
1,380 |
|
Ethyl benzene |
738 |
|
Nonane |
11,540 |
|
Ethanethiol |
13 |
|
Decanes |
3,608 |
|
Limonene |
212 |
|
Butyl benzene |
47 |
|
Undecane |
5,562 |
|
Butanethiol |
4 |
|
Terpenes |
NA (a) |
|
Xylenes |
534 |
|
Dichlorobenzene |
120 |
|
Notes: (a) No relevant WHO/USEPA/CARB’s ambient criteria, odour thresholds and WEL available. |
|
Ambient air
samples were drawn into the pre-cleaned and vacuum canister directly when the
valve of the flow controller (with preset flow rate) was opened. After
sampling, the valve will be closed manually and the canister with VOCs gas
samples were transported for laboratory analysis.
Pre-cleaned
Tedlar bag was placed in the vacuum chamber.
Ambient air was collected in the Tedlar bag under the
vacuum condition when the pump is switched on. The Tedlar
bag was filled up to 90% of total capacity to avoid leakage and bag
deformation. After sampling, pump is switched
off and the valve of Tedlar
bag was closed manually. The air samples were transported back to laboratory for analysis.
Calibrated
personal air pump was used to pump the air through a sulfuric acid-treated
silica gel sorbent tube. Gaseous ammonia in air was then trapped in the
sorbent tube. The tube was transported back to laboratory
for analysis.
H2S
in air is collected in mid-get impingers by aspirating a measured
volume of air through an alkaline suspension of cadmium hydroxide (as the
absorbing solution). The sulphide is
precipitated as cadmium sulphide to prevent air
oxidation of the sulphide. Arabinogalactan is
added to the cadmium hydroxide slurry prior to sampling to minimize photo-decomposition of the precipitated cadmium sulphide. The solution is transported back to laboratory for analysis.
All air
samples collected for laboratory analysis were transported to ALS Technichem (HK) Pty Ltd. (HOKLAS Registration No. 066)
laboratory within 24 hours and analysed within 48
hours.
The ambient
VOCs, ammonia and H2S monitoring programme
and monitoring locations are summarised in Table
2.16 and illustrated in Figure 2.1, respectively.
Table 2.16
ambient vocs, ammonia and h2s monitoirng details
|
Monitoring Station |
Location |
Parameter |
Frequency |
Monitoring Date |
|
AM1 |
SENTX Site Boundary (North) |
· Methane · Ammonia · A suite of VOCs (a) · H2S |
Quarterly |
16 Feb
2024, 10 May
2024, 22 Aug
2024, 15 Nov 2024 |
|
AM2 |
SENTX Site Boundary (West, near DP3) |
|||
|
AM3 |
SENTX Site Boundary (West, near RC15) |
|||
|
AM4 |
SENTX Site Boundary (West, near EPD building) |
|||
|
Notes: (a) A suite of VOCs includes: |
||||
|
· Butyl benzene · Xylenes · Decanes · Undecane · Limonene · Terpenes · Ethanol · Butan-2-ol · Dimethylsulphide · Methyl propionate · Ethyl propionate · Propyl propionate · Butyl acetate
|
· Dichlorobenzene · Methyl butanoate · Dipropyl ether · Methanethiol · Ethanethiol · Butanethiol · Methanol · Heptanes · Octanes · Nonanes · Dichlorodifluoro-methane
|
||
The
schedule for ambient VOCs, ammonia and H2S monitoring during the
reporting period is provided in Annex
C.
The ambient
VOCs, ammonia and H2S monitoring results are summarized in Tables
2.17 and provided in Annex
D6.
Table 2.17
summary of ambient vocs, ammonia and h2s monitoring results in the reporting
period
|
Parameters
|
Limit Level (μg m-3) |
Monitoring Results (μg m-3) (Average)
|
|||
|
|
|
AM1 |
AM2 |
AM3 |
AM4
|
|
Ammonia |
180 |
22.5 |
33.5 |
33.0 |
31.5 |
|
H2S |
42 |
<15 |
<15 |
<15 |
<15 |
|
Methane |
NA (a) |
0.00019 %(v/v) |
0.00028 %(v/v) |
0.00020 %(v/v) |
0.00020 %(v/v) |
|
1.1.1-Trichloroethane |
5,550 |
<0.8 |
<0.8 |
<0.8 |
<0.8 |
|
1.2-Dibromoethane (EDB) |
39 |
<1.0 |
<1.0 |
<1.0 |
<1.0 |
|
1.2-Dichloroethane |
210 |
0.3 |
0.4 |
0.4 |
0.4 |
|
Benzene |
33 |
0.8 |
0.7 |
1.9 |
0.7 |
|
Butan-2-ol |
667 |
<0.6 |
1.2 |
<0.6 |
<0.6 |
|
Butanethiol |
4 |
<1.2 |
<1.2 |
<1.2 |
<1.2 |
|
Carbon Disulphide |
150 |
0.6 |
1.0 |
0.7 |
0.6 |
|
Carbon Tetrachloride |
64 |
<0.6 |
0.6 |
0.6 |
0.6 |
|
Chloroform |
99 |
<0.8 |
<0.8 |
<0.8 |
<0.8 |
|
Decanes |
3,608 |
<0.7 |
1.4 |
<0.7 |
<0.7 |
|
Dichlorobenzene |
120 |
<1.0 |
<1.0 |
<1.0 |
<1.0 |
|
Dichlorodifluoro-methane |
NA (a) |
1.5 |
1.6 |
1.9 |
1.7 |
|
Dimethylsulphide |
8 |
<0.2 |
<0.2 |
<0.2 |
<0.2 |
|
Dipropyl ether |
NA (a) |
<0.8 |
<0.8 |
<0.8 |
<0.8 |
|
Limonene |
212 |
0.5 |
0.5 |
0.5 |
0.4 |
|
Ethanethiol |
13 |
<0.6 |
<0.6 |
<0.6 |
<0.6 |
|
Ethanol |
19,200 |
4.6 |
6.8 |
5.8 |
7.6 |
|
Ethyl butanoate |
71 |
<1.0 |
<1.0 |
<1.0 |
<1.0 |
|
Ethyl propionate |
29 |
<0.8 |
<0.8 |
<0.8 |
<0.8 |
|
Ethyl benzene |
738 |
<0.5 |
8.2 |
0.6 |
0.6 |
|
Heptane |
2,746 |
<0.8 |
1.1 |
<0.8 |
1.0 |
|
Methanethiol |
10 |
<0.4 |
<0.4 |
<0.4 |
<0.4 |
|
Methanol |
2,660 |
28.7 |
30.9 |
26.3 |
32.6 |
|
Methyl butanoate |
30 |
<0.8 |
<0.8 |
<0.8 |
<0.8 |
|
Methyl propionate |
353 |
<0.7 |
<0.7 |
<0.7 |
<0.7 |
|
Methylene Chloride |
3,530 |
1.6 |
2.3 |
1.7 |
1.4 |
|
Butyl acetate |
76 |
<1.0 |
1.3 |
<1.0 |
<1.0 |
|
Butyl benzene |
47 |
<1.0 |
<1.0 |
<1.0 |
<1.0 |
|
Nonane |
11,540 |
<0.9 |
1.8 |
<0.9 |
<0.9 |
|
Propyl benzene |
19 |
<0.8 |
<0.8 |
<0.8 |
<0.8 |
|
Octane |
7,942 |
<0.9 |
<0.9 |
<0.9 |
<0.9 |
|
Propyl propionate |
276 |
<1.0 |
<1.0 |
<1.0 |
<1.0 |
|
Terpenes |
NA (a) |
0.8 |
<0.8 |
0.9 |
<0.8 |
|
Tetrachloroethylene |
1,380 |
0.7 |
<0.7 |
<0.7 |
<0.7 |
|
Toluene |
1,244 |
1.3 |
2.0 |
1.4 |
1.2 |
|
Trichloroethylene |
5,500 |
<1.1 |
<1.1 |
<1.1 |
<1.1 |
|
Undecane |
5,562 |
<1.2 |
<1.2 |
<1.2 |
<1.2 |
|
Vinyl Chloride |
26 |
<0.3 |
<0.3 |
<0.3 |
<0.3 |
|
Xylenes |
534 |
0.7 |
10.8 |
0.7 |
0.6 |
|
(a) No relevant WHO/USEPA/CARB’s ambient criteria and WEL available. |
|||||
All ambient VOCs, ammonia and H2S monitoring results were
below the Limit Levels in the reporting period. No action is thus
required to be undertaken in accordance with the Event and Action Plan
presented in Annex D2.
According
to the updated EM&A Manual of the Project, noise levels at noise monitoring location NM1 and NM2 should be
monitored during the first 3 years of operation and during the next 3 years of
operation until the completion of the Restoration phase, respectively. Impact
noise monitoring was conducted weekly at the monitoring location (i.e. at NM1
before 20 November 2024; and at NM2 from 20 November 2024) to obtain one set of
30-minute measurement between 07:00 and 19:00
hours on normal weekdays.
The Action
and Limit Levels for operational noise of the Project are provided in Table
2.18 below.
Table 2.18
Action and Limit Levels for Operational Noise
|
Time Period |
Action Level (a) |
Limit Level (b) |
|
07:00 – 19:00 hrs on all days
|
When one documented complaint is received from any one of the noise sensitive receivers (NSRs) or 75 dB(A) recorded at the monitoring station |
65 dB(A) at NSRs (c) |
|
19:00 – 23:00 hrs on all days
|
65 dB(A) at NSRs (c) |
|
|
23:00 – 07:00 hrs on all days |
55 dB(A) at NSRs (c) |
|
|
Notes: (a) 75dB(A) along and at about 100m from the SENTX site boundary was set as the Action Level. (b) Limits specified in the GW-TM and IND-TM for construction and operational noise, respectively. (c) Limit Level only apply to operational noise without road traffic and construction activities noise. |
||
Noise monitoring was performed by ALS Technichem
(HK) Pty Ltd. (HOKLAS Registration No. 066) using sound level meter at the
designated monitoring station
NM1 and NM2 (see Figure
2.1) in accordance with the requirements stipulated in the updated EM&A Manual. Acoustic calibrator was
deployed to check the sound level meter at a known sound pressure level.
Details of the deployed equipment are provided in Table
2.19.
Table 2.19
Noise Monitoring Details
|
Monitoring Station (1) |
Location |
Parameter |
Frequency and Duration |
Monitoring Dates |
Equipment |
|
NM1 |
SENTX Site Boundary (North) |
Leq
(30 min) measurement between 07:00 and 19:00 hours
on normal weekdays (Monday to Saturday) |
Once per week for 30 mins during operation of the
Project |
3, 9, 15, 22, 29 Jan
2024 8, 14, 20, 26 Feb
2024 4, 11, 21, 27 Mar 2024 2, 8, 15, 22 Apr 2024 2, 8, 14, 20, 27 May
2024 3, 14, 19, 25 Jun 2024 2, 8, 15, 25, 31 Jul
2024 6, 12, 19, 26 Aug
2024 5, 11, 17, 23, 30
Sep 2024 7,
14, 23, 29 Oct 2024 4, 11, 18 Nov 2024 |
Sound Level Meter: Rion NL-52 (S/N:
00643049) Rion NL-52 (S/N: 01010406) Acoustic Calibrator: CAL200 (S/N: 16878) Rion NL-52 (S/N: 01010406) CAL200 (S/N: 11333)
|
|
NM2 |
SENTX Site Boundary (East) |
28 Nov 2024 4, 10, 16, 23, 31 Dec 2024 |
The
schedule for noise monitoring during the reporting period is provided in Annex C.
A total of
57 impact noise monitoring events were scheduled during the reporting period.
However, noise monitoring on 4
and 11 March 2024, 20 May 2024, 3 and 14 June 2025, 2 July 2024, 12 August 2024
and 5 September 2024 were cancelled due to adverse weather. Results for
noise monitoring are summarised in Table 2.20.
The monitoring results and the graphical presentation of the data are provided
in Annex E1.
Table 2.20
Summary of Operation Noise Monitoring Results in the Reporting Period
|
Month |
Monitoring Station |
Measured Noise Level Leq (30 min), dB(A) |
||
|
Average |
Range |
Action and Limit Level |
||
|
January
2024 |
NM1 |
52.2 |
50.2 –
54.4 |
75 |
|
February
2024 |
52.0 |
47.2 –
54.4 |
||
|
March
2024 |
51.7 |
51.5 –
51.9 |
||
|
April
2024 |
55.7 |
54.6 –
56.7 |
||
|
May
2024 |
54.7 |
51.1 –
60.8 |
||
|
June
2024 |
56.8 |
56.7 –
56.9 |
||
|
July
2024 |
56.3 |
54.1 –
58.0 |
||
|
August
2024 |
54.0 |
51.6 –
56.3 |
||
|
September
2024 |
54.1 |
51.8 –
57.3 |
||
|
October
2024 |
53.4 |
53.1 –
53.8 |
||
|
November
2024 |
54.5 |
50.8 –
58.5 |
||
|
NM2 |
46.2 |
- |
75 |
|
|
December
2024 |
47.3 |
42.8 –
50.3 |
||
|
47.3 |
42.8 –
50.3 |
75 |
||
Major noise sources identified during the noise monitoring included
noise from operations of the SENTX and the TKO Area 137 Fill Bank, aircrafts and insects
at NM1 and noise from aircrafts at NM2.
No exceedance of the Action and Limit Levels for
operation noise monitoring was recorded in the reporting period. No
further mitigation measure was required in accordance with the Event and Action
Plan presented in Annex E2.
According
to the updated EM&A Manual of the Project, impact surface water quality
monitoring was carried out at the three designated surface water discharge
points (i.e. DP3, DP4 and DP6) at monthly intervals during operation/
restoration phase to ensure that the SENTX will not cause adverse water quality
impact.
The parameters as listed in Table 2.22 were determined by
ALS Technichem (HK) Pty Ltd. (HOKLAS Registration No.
066).
The Limit
Levels of the surface water quality impact monitoring are provided in Table
2.21.
Table 2.21
Limit Levels for Surface Water Quality
|
Parameters |
Limit Level |
|
DP3 |
|
|
Ammoniacal-nitrogen |
> 0.5 mg/L |
|
COD |
> 80 mg/L |
|
SS |
> 30 mg/L |
|
DP4 & DP6 |
|
|
Ammoniacal-nitrogen |
> 7.1 mg/L |
|
COD |
> 30 mg/L |
|
SS |
> 20 mg/L |
|
Notes: The limit levels specified for other parameters in Table 10a of the Technical Memorandum Standards for Effluents Discharged into Drainage and Sewerage Systems, Inland and Coastal Waters shall also be followed. |
|
The locations of the monitoring stations for the Project are shown in Figure 2.1. All in situ monitoring instruments were checked, calibrated and certified by a laboratory accredited under
HOKLAS or other international accreditation scheme before use, and subsequently
re-calibrated at 3 monthly intervals throughout all stages of the surface water
quality monitoring programme. Calibration for a
DO meter was carried out before measurement according to the instruction manual
of the equipment model. Details of the equipment used in the impact surface
water quality monitoring works are provided in Table 2.22.
Table 2.22
Impact Surface Water Quality Monitoring
Details
|
Monitoring Station |
Location |
Frequency |
Monitoring Dates |
Parameter |
Equipment |
|
|
DP3 |
Surface water discharge point DP3 |
Monthly |
5 Jan 2024, 2 Feb 2024, 8 Mar 2024, 12 Apr 2024, 6 May 2024, 16 May 2024 (Remeasurement at DP3 & DP6), 30 May 2024 (Remeasurement at DP3 & DP6), 5 Jun 2024 (Remeasurement at DP6), 12 Jun 2024, 24 Jun 2024
(Remeasurement at DP4), 5 Jul 2024
(Remeasurement at DP4), 9 Jul 2024, 18 Jul 2024
(Remeasurement at DP4), 7 Aug 2024, 11 Sep 2024, 9 Oct 2024, 8 Nov 2024, 3 Dec 2024 |
·
pH ·
Electrical conductivity (EC) ·
DO ·
SS ·
COD ·
BOD5 ·
TOC ·
Ammoniacal–nitrogen ·
Nitrate-nitrogen ·
Nitrite–nitrogen ·
TKN ·
TN ·
Phosphate ·
Sulphate ·
Sulphide ·
Carbonate ·
Oil & Grease |
·
Bicarbonate ·
Chloride ·
Sodium ·
Potassium ·
Calcium ·
Magnesium ·
Nickel ·
Manganese ·
Chromium ·
Cadmium ·
Copper ·
Lead ·
Iron ·
Zinc ·
Mercury ·
Boron |
Horiba U-52G (S/N: NVAE080GT) Horiba U-52G (S/N: AWE7D2V4) |
|
DP4 |
Surface water discharge point DP4 |
|
||||
|
DP6 |
Surface water discharge point DP6 |
|
|
|||
The
schedule for surface water quality monitoring during the reporting period is
provided in Annex C.
Twelve
regular monitoring events for impact surface water quality monitoring were
scheduled at all designated monitoring stations during the reporting period.
However, sampling could not be
carried out at all monitoring stations in January to April 2024, July to August
2024 and October to December 2024, at DP4 in May 2024, at DP3 in June 2024, at
DP4 and DP6 in September 2024 due to insufficient flow. Details of impact water
quality monitoring event are provided in Annex F1.
Limit Level exceedance (ammoniacal-nitrogen) on 6 May
2024 at DP3 and Limit Level exceedance (SS) on 6 May 2024 at DP6 and on 12 June
2025 at DP4, respectively, were recorded for surface water quality impact
monitoring. Actions in accordance with the Event and Action Plan in Annex F2 were undertaken.
Investigation of the Limit Levels exceedances was conducted
and the investigation reports are presented in Annex F6.
The additional surface water monitoring at DP3 for
ammoniacal-nitrogen and at DP6 for SS were conducted on 16 May 2024 and 30 May
2024. The ammoniacal-nitrogen exceedance at DP3 and the SS exceedances at DP6
on 6 May 2024 were found deemed to Project-related activities upon further
investigation. The monitoring frequency shall be increased to weekly in
accordance with Table 4.5b of the updated EM&A Manual until no exceedance
of Limit Level. Since the ammoniacal-nitrogen results at DP3 of the additional
monitoring event conducted on 30 May 2024 were well below the Limit Level, the
weekly surface water monitoring at DP3 was not triggered. Weekly surface water
quality monitoring (SS) was continued at DP6 until no exceedance of Limit
Level. Afterwards, the additional surface water monitoring (SS) at DP6 were
conducted on 5 June 2025 and the SS results complied with the Limit Level as
stipulated in the updated EM&A Manual, the weekly surface water monitoring
(SS) at DP6 was terminated.
The additional surface water monitoring at DP4 for SS
was conducted on 24 June 2024, 5 July 2024, 9 July 2024 and 18 July 2024. The
SS exceedances at DP4 on 12 June 2024 were found deemed to Project-related
activities upon further investigation. The monitoring frequency shall be
increased to weekly in accordance with Table 4.5b of the updated EM&A
Manual until no exceedance of Limit Level. Since the SS results at DP4 of the
additional monitoring event conducted on 18 July 2024 were well below the Limit
Level, the weekly surface water monitoring at DP4 was not triggered.
The results of
the additional surface water monitoring for those exceedances are summarized in
Table 2.23 below.
Table 2.23 Details of Additional
Surface Water Quality Monitoring
|
Date |
Monitoring
Location |
Parameter |
Result |
Limit
Level |
Remarks |
|
6
May 2024 |
DP3 |
Ammoniacal-nitrogen |
1.38
mg/L |
0.5
mg/L |
Project-related |
|
DP6 |
SS |
22 mg/L |
20 mg/L |
Project-related |
|
|
16
May 2024 |
DP3 |
Ammoniacal-nitrogen |
- |
0.5
mg/L |
Insufficient
flow |
|
DP6 |
SS |
20 mg/L |
|||
|
30
May 2024 |
DP3 |
Ammoniacal-nitrogen |
0.18
mg/L |
0.5
mg/L |
Below
Limit Level |
|
DP6 |
SS |
34.3
mg/L |
20 mg/L |
Weekly monitoring
shall be
continued |
|
|
5
June 2024 |
5.4
mg/L |
Below
Limit Level |
|||
|
12 June
2024 |
DP4 |
SS |
395
mg/L |
20 mg/L |
Project-related |
|
24
June 2024 |
- |
Insufficient
flow |
|||
|
7
July 2024 |
|||||
|
9
July 2024 |
|||||
|
18
July 2024 |
11.8
mg/L |
Below
Limit Level |
Based on the investigation conducted for the monitoring event with
potential Limit Levels exceedances with the Contractor, and the IEC, the surface water
(ammoniacal-nitrogen) exceedance at DP3 and the surface water (SS) exceedances
at DP4 and DP6 on 6 May 2024 and 12 June 2024, respectively, were found deemed
to Project-related activities.
The
Contractor was reminded to implement all relevant mitigation measures for the
construction works and maintain good site practice. The ET will keep
track on the monitoring data and ensure Contractor’s compliance of the
environmental requirements.
According
to the updated EM&A Manual, continuous monitoring of leachate level and
monthly monitoring of effluent quality were carried out during the operation/
restoration phase.
Reduction
of effluent monitoring frequency (dry season) (from daily to monthly) was
approved by EPD on 22 March 2022. Monthly effluent quality monitoring
(dry season) shall be conducted from 23 March 2022. The reduction of
effluent monitoring frequency (wet season) (from daily to monthly) was approved
by EPD on 2 August 2022. Monthly effluent quality monitoring (wet season)
shall be conducted from 3 August 2022.
Temperature,
pH and volume of the effluent discharged from the leachate treatment plant were
measured in-situ whereas the parameters as listed in Table 2.25 were determined by ALS Technichem
(HK) Pty Ltd. (HOKLAS Registration No. 066).
The Limit
Levels of the leachate monitoring are provided in Table 2.24.
Table 2.24 Limit Levels for Leachate Levels and Effluent
Quality
|
Parameters |
Limit Level |
|
Leachate Levels |
|
|
Leachate levels above the basal liner |
1 m above the primary liner of the leachate containment system |
|
Effluent Quality |
|
|
Temperature |
> 43 °C |
|
pH Value |
6 – 10 |
|
Volume Discharged |
>2,000 m³ |
|
Suspended Solids (SS) |
> 800 mg/L |
|
Phosphate |
> 25 mg/L |
|
Sulphate |
> 800 mg/L |
|
Total Inorganic Nitrogen (a) |
> 100 mg/L |
|
Biochemical Oxygen Demand (BOD) |
> 800 mg/L |
|
Chemical Oxygen Demand (COD) |
> 2,000 mg/L |
|
Oil & Grease |
> 20 mg/L |
|
Boron |
> 7,000 µg/L |
|
Iron |
> 5 mg/L |
|
Cadmium |
> 1 µg/L |
|
Chromium |
> 300 µg/L |
|
Copper |
> 1,000 µg/L |
|
Nickel |
> 700 µg/L |
|
Zinc |
> 700 µg/L |
|
Note: (a) Total Inorganic Nitrogen include Ammoniacal-nitrogen, Nitrite-nitrogen and Nitrate-nitrogen. |
|
All in situ monitoring instruments were checked, calibrated and
certified by a laboratory accredited under HOKLAS or other international
accreditation scheme before use, and subsequently re-calibrated at 3 monthly
intervals throughout all stages of the leachate quality monitoring programme. Details of the equipment used are provided
in Table 2.25.
Table 2.25
Leachate Levels and Effluent Quality Monitoring Details
|
Location |
Frequency |
Parameter |
Monitoring Dates |
Equipment |
|
Leachate levels above the basal liner
|
Continuous |
Leachate
Levels |
1 Jan –
31 Dec 2024 |
Pairs
of pressure transducers |
|
Effluent discharged from LTP |
Daily for the first 3 months upon full operation of the LTP at wet season (Apr to Sep) and dry season (Oct to Mar), respectively and reduce to monthly thereafter subject to the monitoring results of the first 3 months for each season and agreement with the EIAO Authority, IEC and IC. (a) |
On-site
Measurements: · Volume · pH · Temperature Laboratory
analysis: · Suspended Solids · COD · BOD5 · TOC · Ammoniacal–nitrogen · Nitrate-nitrogen · Nitrite–nitrogen · Total Nitrogen · Sulphate · Phosphate · Oil & Grease · Alkalinity · Chloride · Calcium · Potassium · Magnesium · Iron · Zinc · Copper · Chromium · Nickel · Cadmium · Boron |
4 Jan 2024, 1 Feb 2024, 7 Mar 2024, 11 Apr 2024, 9 May 2024, 13 June 2024, 11 Jul 2024, 15 Aug 2024, 4 Sep 2024, 3 Oct 2024, 7 Nov 2024, 4 Dec 2024 |
Lutron PH-208 (S/N:
TF31039) Lutron PH-208 (S/N:
TF30605) TOA-DKK HM-30P (S/N:
790332) YSI Pro Quatro (S/N:
23C105530) Lutron PH-208 (S/N: TF64331) |
|
Note: (a) Reduction of monitoring frequency will be subject to the monitoring results to demonstrate environmentally acceptable performance. |
||||
The
schedule for leachate monitoring during the reporting period is provided in Annex C.
The
leachate levels and effluent quality monitoring results are summarised
in Table 2.26 and Table 2.27,
respectively. The detailed monitoring results are provided in Annex F3 and Annex F4, respectively.
Table 2.26
Summary of Leachate Levels in the Reporting Period
|
Monitoring Location |
Average Leachate Head Levels (cm) (Range in Bracket) |
Limit Level (cm) |
|
Pump Station No. 1X (Cell 1X) |
||
|
Meter No. X-1 |
111 (70
– 155) |
> 178 |
|
Meter No. X-2 (a) |
115 (88
– 153) |
|
|
Average |
113 (79
– 143) |
|
|
Pump
Station No. 2X (Cell 2X) |
||
|
Meter No. X-3 |
108 (85
– 130) |
> 180 |
|
Meter No. X-4 |
118 (93
– 148) |
|
|
Average |
113 (91
– 138) |
|
|
Pump
Station No. 3X (Cell 3X) |
||
|
Meter No. X-5 |
112 (97
– 139) |
> 175 |
|
Meter No. X-6 |
111 (93
– 139) |
|
|
Average |
111 (95
– 139) |
|
|
Pump
Station No. 4X (Cell 4X) |
||
|
Meter No. X-7 |
108 (70
– 142) |
> 186 |
|
Meter No. X-8 |
112 (92
– 144) |
|
|
Average |
110 (89
– 142) |
|
|
Note: (a)
Meter No. X-2 at Pump
Station No. 1X was on standby in January 2024. |
||
Table 2.27
Summary of Effluent Quality Monitoring Results in the Reporting Period
|
Parameters |
Monitoring Results |
Limit Level |
|||
|
|
|
Average |
Min |
Max |
|
|
Temperature |
°C |
30 |
19.8 |
36.1 |
> 43 °C |
|
pH Value |
pH unit |
8.4 |
8.2 |
8.5 |
6 – 10 |
|
Volume Discharged |
m³ |
965 |
108 |
1829 |
>2,000 m³ |
|
Suspended Solids (SS) |
mg/L |
29.9 |
14.0 |
56.8 |
> 800 mg/L |
|
Phosphate |
mg/L |
5.7 |
1.9 |
9.5 |
> 25 mg/L |
|
Sulphate |
mg/L |
185.8 |
120.0 |
296.0 |
> 800 mg/L |
|
Total Inorganic Nitrogen (a) |
mg/L |
41.2 |
28.8 |
64.4 |
> 100 mg/L |
|
BOD |
mg/L |
13.8 |
6 |
32 |
> 800 mg/L |
|
COD |
mg/L |
875.8 |
609 |
1130 |
> 2,000 mg/L |
|
Oil & Grease |
mg/L |
<5 |
<5 |
<5 |
> 20 mg/L |
|
Boron |
µg/L |
5092.5 |
3020.0 |
6310.0 |
> 7,000 µg/L |
|
Iron |
mg/L |
1.7 |
1.3 |
2.4 |
> 5 mg/L |
|
Cadmium |
µg/L |
<1.0 |
<1.0 |
<1.0 |
> 1 µg/L |
|
Chromium |
µg/L |
108.1 |
69 |
140 |
> 300 µg/L |
|
Copper |
µg/L |
18 |
18 |
18 |
> 1,000 µg/L |
|
Nickel |
µg/L |
111.3 |
67 |
177 |
> 700 µg/L |
|
Zinc |
µg/L |
49.8 |
26 |
79 |
> 700 µg/L |
All effluent quality monitoring results were below
the Limit Levels in the reporting period. No action is thus required to be
undertaken in accordance with the Event and Action Plan presented in Annex F2.
According
to the updated EM&A Manual of the Project with incorporation of the
proposed updates under the Amendment Summary approved by EPD on 15 June 2020,
groundwater monitoring was carried out at 14 perimeter groundwater monitoring
wells (including 3 up-gradient wells and 11 down-gradient wells) (i.e. MWX-1 to
MWX-14) to monitor the groundwater quality and level of the perimeter
groundwater monitoring wells at monthly interval.
The Limit
Levels for groundwater quality are provided in Table 2.28 below.
Table
2.28 Limit Levels for Groundwater Quality
|
Location
|
Limit Levels |
|
|
Ammoniacal-nitrogen (mg L-1) |
COD (mg L-1) |
|
|
MWX-1 |
5.00 |
30 |
|
MWX-2 |
5.00 |
30 |
|
MWX-3 |
5.00 |
30 |
|
MWX-4 |
7.63 |
36 |
|
MWX-5 |
5.00 |
30 |
|
MWX-6 |
5.00 |
46 |
|
MWX-7 |
6.55 |
36 |
|
MWX-8 |
15.85 |
50 |
|
MWX-9 |
7.30 |
71 |
|
MWX-10 |
5.00 |
30 |
|
MWX-11 |
5.00 |
30 |
|
MWX-12 |
5.00 |
30 |
|
MWX-13 |
5.00 |
30 |
|
MWX-14 |
5.00 |
30 |
A bladder pump with Teflon sampling tube and adjustable discharge rates
was used for purging and taking of groundwater sample from the monitoring wells. Filtered groundwater
samples were collected by connecting a disposable in-line filter system to the
tubing of the sampling pump, prior to storage and analysis by ALS Technichem (HK) Pty Ltd. (HOKLAS Registration No.
066). A portable dip meter with 5mm accuracy was used for measurement of
groundwater level at each well. The dip meter has an audio indicator of
the water level and was checked before use.
The
measurements of pH and electrical conductivity (EC) were undertaken in situ.
In situ monitoring instruments in compliance with the specifications
listed under Section 4.3.2 of the updated EM&A Manual were used to
undertake the groundwater quality monitoring for the
Project.
Details of
the equipment used and the monitoring locations are summarised in Table 2.29
and illustrated in Figure
2.1, respectively.
Table
2.29 groundwater monitoirng details
|
Location |
Frequency |
Parameter |
Monitoring Dates |
Equipment |
|
|
All groundwater monitoring wells (MWX-1 to MWX-14) |
Monthly |
· Water level · pH · EC · COD · BOD5 · TOC · Ammoniacal–nitrogen · Nitrate-nitrogen · Nitrite–nitrogen · TKN · TN · Sulphate · Sulphide · Carbonate · Bicarbonate · Phosphate |
· Chloride · Sodium · Potassium · Calcium · Magnesium · Nickel · Manganese · Chromium · Cadmium · Copper · Lead · Iron · Zinc · Mercury · Boron |
8 Jan 2024, 1 Feb 2024, 6 Mar 2024, 10 Apr 2024, 3, 16 May 2024, 12 Jun 2024, 5 Jul 2024, 8 Aug 2024, 12 Sep 2024, 2 Oct 2024, 5 Nov 2024, 3 Dec 2024 |
Horiba U-52G (S/N: NVAE080GT) Horiba U-52G (S/N: AWE7D2V4) |
The schedule
for groundwater quality monitoring during the reporting period is provided in Annex C.
The
groundwater quality monitoring results and detailed monitoring results are summarised in Table 2.30
and provided in Annex
F5, respectively.
Table 2.30
Summary of Groundwater Monitoring Results in the Reporting Period
|
|
Ammoniacal-nitrogen (mg L-1) |
COD (mg L-1) |
||||||
|
Monitoring Results |
Limit Levels |
Monitoring Results |
Limit Levels |
|||||
|
Average |
Min |
Max |
Average |
Min |
Max |
|||
|
MWX-1 |
0.16 |
0.01 |
0.61 |
5.00 |
7 |
4 |
11 |
30 |
|
MWX-2 |
0.21 |
0.01 |
1.05 |
5.00 |
6 |
3 |
21 |
30 |
|
MWX-3 |
0.96 |
0.05 |
1.61 |
5.00 |
15 |
9 |
22 |
30 |
|
MWX-4 |
2.03 |
0.09 |
5.30 |
7.63 |
17 |
8 |
26 |
36 |
|
MWX-5 |
1.73 |
0.19 |
6.59 |
5.00 |
21 |
11 |
42 |
30 |
|
MWX-6 |
3.80 |
2.49 |
5.74 |
5.00 |
44 |
34 |
53 |
46 |
|
MWX-7 |
4.50 |
0.14 |
6.92 |
6.55 |
21 |
6 |
49 |
36 |
|
MWX-8 |
9.19 |
3.56 |
15.70 |
15.85 |
38 |
28 |
51 |
50 |
|
MWX-9 |
0.46 |
0.01 |
1.02 |
7.30 |
28 |
<20 |
108 |
71 |
|
MWX-10 |
0.02 |
<0.01 |
0.03 |
5.00 |
5 |
3 |
10 |
30 |
|
MWX-11 |
0.05 |
<0.01 |
0.08 |
5.00 |
5 |
3 |
7 |
30 |
|
MWX-12 |
0.03 |
<0.01 |
0.04 |
5.00 |
4 |
<2 |
5 |
30 |
|
MWX-13 |
0.08 |
<0.01 |
0.20 |
5.00 |
4 |
<2 |
7 |
30 |
|
MWX-14 |
0.02 |
<0.01 |
0.03 |
5.00 |
4 |
<2 |
7 |
30 |
Limit Level exceedances were recorded for groundwater monitoring in the
reporting period and actions in accordance with the Event and Action Plan
presented in Annex F2
were undertaken. Investigation of the Limit Levels exceedances was conducted and the investigation reports are presented
in Annex F6.
Based on the investigation conducted for the
monitoring event with potential Limit Levels exceedances with the Contractor
and the IEC, the groundwater (ammoniacal-nitrogen) exceedance at MWX-6 on 6
March 2024, at MWX-5 on 3 May 2024, at MWX-7 on 5 August 2024 and 3 December
2024 were considered non Project-related and the
groundwater (COD) exceedances at MWX-5 on 3 May 2024, at
MWX-6 on 8 January 2024, 1 February 2024 and 6 March 2024,
10 April 2024 and 3 May 2024, at MWX-7 on 12 June 2024, 5 July 2024, 5 August
2024 and 3 December 2024, at MWX-8 on 6 March 2024, at MWX-9 on 5 July 2024
were considered non Project-related.
The
Contractor was reminded to implement all relevant mitigation measures for the
construction and operation works and maintain good site practice. The ET
will keep track on the monitoring data and ensure Contractor’s compliance of the
environmental requirements.
According
to the updated EM&A Manual of the Project, landfill gas monitoring was
carried out at the perimeter of the waste boundary (monitoring wells), area
between the SENTX Site boundary and the waste boundary (surface emission),
occupied on-site building, service voids, utilities pit and manholes in the
vicinity of the SENTX (build-up of landfill gas) during the
operation/restoration phase.
Furthermore, the flammable gas surface emission survey route has been reviewed
and updated against the latest construction/ operation programme
and approved by EPD on 17 June 2024.
The Limit
Levels for landfill gas monitoring is provided in Table
2.31 below.
Table 2.31
Limit Levels for Landfill Gas Constituents
|
Parameters |
Monitoring Location |
Limit Level (% (v/v)) |
|
|
Perimeter Landfill Gas Monitoring Wells (a) |
|||
|
Methane & Carbon Dioxide |
|
Methane |
Carbon Dioxide |
|
LFG1 |
1.0 |
3.2 |
|
|
LFG2 |
1.0 |
4.3 |
|
|
LFG3 |
1.0 |
6.3 |
|
|
LFG4 |
1.0 |
7.0 |
|
|
LFG5 |
1.0 |
3.4 |
|
|
LFG6 |
1.0 |
9.1 |
|
|
LFG7 |
1.0 |
1.5 |
|
|
LFG8 |
12.6 |
2.4 |
|
|
LFG9 |
2.5 |
1.7 |
|
|
LFG10 |
3.5 |
1.6 |
|
|
LFG11 |
3.0 |
2.0 |
|
|
LFG12 |
13.2 |
1.5 |
|
|
LFG13 |
22.5 |
2.7 |
|
|
LFG14 |
5.2 |
1.8 |
|
|
LFG15 |
18.2 |
2.0 |
|
|
LFG16 |
1.0 |
2.0 |
|
|
LFG17 |
17.8 |
2.4 |
|
|
LFG18 |
2.3 |
2.1 |
|
|
LFG19 |
6.3 |
3.1 |
|
|
LFG20 |
1.0 |
4.6 |
|
|
LFG21 |
1.0 |
4.8 |
|
|
LFG22 |
1.0 |
4.0 |
|
|
LFG23 |
1.0 |
10.3 |
|
|
LFG24 |
1.0 |
4.7 |
|
|
GP1 |
1.0 |
10.6 |
|
|
GP2 (shallow) |
1.0 |
11.4 |
|
|
GP2 (deep) |
1.0 |
10.4 |
|
|
GP3 (shallow) |
1.0 |
6.9 |
|
|
GP3 (deep) |
1.0 |
5.6 |
|
|
GP4 (shallow) |
1.0 |
11.6 |
|
|
GP4 (deep) |
1.0 |
7.7 |
|
|
GP5 (shallow) |
1.0 |
10.8 |
|
|
GP5 (deep) |
1.0 |
7.5 |
|
|
GP6 |
1.0 |
8.4 |
|
|
GP7 |
1.0 |
4.5 |
|
|
GP12 |
1.0 |
2.3 |
|
|
GP15 |
1.0 |
2.2 |
|
|
P7 |
1.0 |
2.5 |
|
|
P8 |
1.0 |
1.7 |
|
|
P9 |
1.0 |
2.7 |
|
|
Service Voids, Utilities Pits and Manholes |
|||
|
Methane (or flammable gas) |
Service voids, utilities pits and manholes |
1% by volume |
|
|
Permanent Gas Monitoring System |
|||
|
Methane (or flammable gas) |
Permanent Gas Monitoring System |
1% by volume (20% LEL) |
|
|
Area Between the SENTX Site Boundary and Waste Boundary (Surface Emission) |
|||
|
Flammable gas |
Area between SENTX site boundary and waste boundary |
30 ppm |
|
|
Notes: (a) Limit Levels established based on the pre-operation phase baseline and additional landfill gas monitoring results in the Pre-operation Baseline Monitoring Report. |
|||
Gas analysers in compliance with the
specifications listed under Section 5.4.1 of the updated EM&A Manual were
used to monitor the gas parameters at the landfill gas monitoring wells,
service voids, utilities pits and manholes. The gas analyser
was calibrated by a laboratory accredited under HOKLAS at yearly intervals and
checked before use to ensure the validity and accuracy of the results. A
portable dip meter was used to monitor the water level in the monitoring wells.
Permanent
gas monitoring systems with pre-set alarm levels for methane at 20% lower
explosive limit (LEL, equivalent to 1% methane gas (v/v)) were installed and
operated in all occupied on-site buildings at SENTX. A central control
panel is equipped to alert site personnel when the gas concentration at any
detector reaches the alarm level.
Flammable
gas detector in compliance with the specifications listed under Section 5.4.1
of the updated EM&A Manual was used to measure flammable gas
concentration. Flammable gas surface emission survey was conducted at a
slow pace with the inlet tube of the meter probe a few centimeters above ground
surface to detect flammable gas emitted from the ground surface.
Bulk gas
samples were collected into inert sample containers (i.e. Tedlar
Bag) and transferred to ALS Technichem (HK) Pty Ltd.
(HOKLAS Registration No. 066) laboratory within 24 hours of collection for
direct analysis on a gas
chromatography within 48 hours after collection.
The
equipment used in the landfill gas monitoring programme
is summarised in Table 2.32. The
landfill gas monitoring locations for perimeter landfill gas monitoring wells
and service voids, utilities and manholes along the Site boundary and within
the SENTX site are illustrated in Figure 2.4 - 2.6 and
Annex G1, respectively.
Table 2.32
Landfill Gas Monitoring Details
|
Monitoring Location |
Frequency |
Parameter |
Monitoring Dates |
Equipment |
|
Perimeter landfill gas monitoring wells (LFG1 to LFG24, P7 to P9, GP1 to GP7, GP12 and GP15)
|
Monthly |
· Methane · Carbon dioxide · Oxygen · Atmospheric pressure |
2 Jan
2024, 6 Feb
2024, 8 Mar
2024, 12 Apr
2024, 8 May
2024, 3 Jun
2024, 9 Jul
2024, 13 Aug
2024, 9 Sep
2024, 9 Oct
2024, 7 Nov
2024, 5 Dec
2024 |
GA5000 (S/N:
G507306) GA5000 (S/N:
G508090) |
|
Service voids, utilities and manholes along the Site boundary and within the SENTX Site (UU1 to UU28) |
Monthly |
· Methane · Carbon dioxide · Oxygen |
2 Jan
2024, 6 Feb
2024, 8
Mar 2024, 12 Apr
2024, 6 May
2024, 3 Jun
2024, 9 Jul
2024, 7 Aug
2024, 9 Sep
2024, 9 Oct
2024, 7 Nov
2024, 5 Dec
2024 |
GA5000 (S/N:
G507306) GA5000 (S/N:
G508090) |
|
Permanent gas monitoring system in all occupied on-site buildings |
Continuous |
Methane (or flammable gas) by permanent gas monitoring system |
1 Jan –
31 Dec 2024 |
Permanent
gas monitoring system |
|
Areas between the SENTX Site boundary and the waste boundary and location of vegetation stress |
Quarterly |
Flammable gas emitted from the ground surface |
6 Feb
2024, 14 May
2024, 22 Aug
2024, 18 Nov
2024 |
GMI
Leak Surveyor (S/N: 554846) |
|
Bulk gas sampling at least 2 of the perimeters LFG monitoring wells |
Quarterly |
· Methane · Carbon dioxide · Oxygen · Nitrogen · Carbon monoxide · Other flammable gas |
6 Feb
2024, 8 May
2024, 13 Aug
2024, 7 Nov
2024, |
Gas
sampling pump and Tedlar bags |
The
schedule for landfill gas monitoring during the reporting period is provided in
Annex C.
The
landfill gas monitoring results are summarised and
provided in Tables 2.33 - 2.36 and
Annex G2, respectively.
Table 2.33 Summary of Landfill Gas Monitoring
Results at Perimeter LFG Monitoring Wells in the Reporting Period
|
Location |
Methane (% (v/v)) |
Carbon Dioxide (% (v/v)) |
||||||
|
Monitoring Results |
Limit Level (a) |
Monitoring Results |
Limit Level (a) |
|||||
|
Average |
Min |
Max |
Average |
Min |
Max |
|||
|
LFG1 |
0.1 |
0.0 |
0.3 |
1 |
0.9 |
0.1 |
1.7 |
3.2 |
|
LFG2 |
0.1 |
0.0 |
0.4 |
1 |
0.7 |
0.0 |
1.6 |
4.3 |
|
LFG3 |
0.1 |
0.0 |
0.3 |
1 |
1.1 |
0.0 |
3.8 |
6.3 |
|
LFG4 |
0.1 |
0.0 |
0.3 |
1 |
0.2 |
0.0 |
1.7 |
7.0 |
|
LFG5 |
0.1 |
0.0 |
0.4 |
1 |
0.2 |
0.1 |
0.5 |
3.4 |
|
LFG6 |
0.1 |
0.0 |
0.3 |
1 |
0.2 |
0.0 |
0.5 |
9.1 |
|
LFG7 |
0.0 |
0.0 |
0.2 |
1 |
0.1 |
0.0 |
0.3 |
1.5 |
|
LFG8 |
0.0 |
0.0 |
0.2 |
12.6 |
0.1 |
0.0 |
0.2 |
2.4 |
|
LFG9 |
0.1 |
0.0 |
0.9 |
2.5 |
0.2 |
0.0 |
0.4 |
1.7 |
|
LFG10 |
0.1 |
0.0 |
1.3 |
3.5 |
0.1 |
0.0 |
0.3 |
1.6 |
|
LFG11 |
0.0 |
0.0 |
0.2 |
3 |
0.1 |
0.0 |
0.2 |
2.0 |
|
LFG12 |
0.1 |
0.0 |
0.3 |
13.2 |
0.1 |
0.0 |
0.7 |
1.5 |
|
LFG13 |
6.1 |
0.0 |
16.5 |
22.5 |
0.2 |
0.0 |
0.8 |
2.7 |
|
LFG14 |
0.1 |
0.0 |
0.3 |
5.2 |
0.1 |
0.0 |
0.3 |
1.8 |
|
LFG15 |
1.1 |
0.0 |
10.8 |
18.2 |
0.4 |
0.0 |
1.5 |
2.0 |
|
LFG16 |
0.0 |
0.0 |
0.1 |
1 |
0.4 |
0.1 |
1.6 |
2.0 |
|
LFG17 |
1.1 |
0.0 |
10.8 |
17.8 |
1.0 |
0.0 |
2.8 |
2.4 |
|
LFG18 |
0.0 |
0.0 |
0.1 |
2.3 |
0.7 |
0.1 |
2.0 |
2.1 |
|
LFG19 |
0.0 |
0.0 |
0.2 |
6.3 |
0.1 |
0.0 |
0.2 |
3.1 |
|
LFG20 |
0.0 |
0.0 |
0.1 |
1 |
0.2 |
0.0 |
0.7 |
4.6 |
|
LFG21 |
0.0 |
0.0 |
0.2 |
1 |
0.1 |
0.0 |
0.6 |
4.8 |
|
LFG22 |
0.0 |
0.0 |
0.1 |
1 |
0.1 |
0.0 |
0.1 |
4.0 |
|
LFG23 |
0.0 |
0.0 |
0.2 |
1 |
0.4 |
0.0 |
2.5 |
10.3 |
|
LFG24 |
0.0 |
0.0 |
0.2 |
1 |
0.1 |
0.0 |
0.1 |
4.7 |
|
GP1 |
0.1 |
0.0 |
0.3 |
1 |
4.2 |
0.1 |
7.9 |
10.6 |
|
GP2 (shallow) |
0.1 |
0.0 |
0.3 |
1 |
0.9 |
0.2 |
1.7 |
11.4 |
|
GP2 (deep) |
0.1 |
0.0 |
0.3 |
1 |
0.3 |
0.1 |
1.2 |
10.4 |
|
GP3 (shallow) |
0.1 |
0.0 |
0.2 |
1 |
0.3 |
0.1 |
1.0 |
6.9 |
|
GP3 (deep) |
0.1 |
0.0 |
0.2 |
1 |
0.3 |
0.1 |
1.3 |
5.6 |
|
GP4 (shallow) |
0.0 |
0.0 |
0.2 |
1 |
0.6 |
0.1 |
1.1 |
11.6 |
|
GP4 (deep) |
0.0 |
0.0 |
0.2 |
1 |
0.8 |
0.1 |
4.2 |
7.7 |
|
GP5 (shallow) |
0.1 |
0.0 |
0.2 |
1 |
3.9 |
0.0 |
8.9 |
10.8 |
|
GP5 (deep) |
0.0 |
0.0 |
0.2 |
1 |
0.1 |
0.1 |
0.2 |
7.5 |
|
GP6 |
0.0 |
0.0 |
0.2 |
1 |
1.4 |
0.1 |
5.6 |
8.4 |
|
GP7 |
0.0 |
0.0 |
0.2 |
1 |
0.4 |
0.1 |
1.2 |
4.5 |
|
GP12 |
0.1 |
0.0 |
0.4 |
1 |
0.2 |
0.0 |
1.3 |
2.3 |
|
GP15 |
0.1 |
0.0 |
0.3 |
1 |
0.0 |
0.0 |
0.2 |
2.2 |
|
P7 |
0.1 |
0.0 |
0.3 |
1 |
0.1 |
0.0 |
0.2 |
2.5 |
|
P8 |
0.1 |
0.0 |
0.3 |
1 |
0.1 |
0.0 |
0.2 |
1.7 |
|
P9 |
0.1 |
0.0 |
0.3 |
1 |
0.1 |
0.0 |
0.6 |
2.7 |
|
Notes: (a) Limit Levels established based on the pre-operation phase baseline and additional landfill gas monitoring results in the Pre-operation Baseline Monitoring Report. |
||||||||
Table 2.34 Summary of Landfill Gas Monitoring
Results at Service Voids, Utilities Pits and Manholes in the Reporting Period
|
Location
|
Methane (% (v/v)) |
|||
|
Monitoring Results |
Limit Levels |
|||
|
|
Average |
Min |
Max |
|
|
UU01 |
0.1 |
0.0 |
0.3 |
1.0 |
|
UU02 |
0.1 |
0.0 |
0.3 |
1.0 |
|
UU03 |
0.0 |
0.0 |
0.0 |
1.0 |
|
UU04 |
0.0 |
0.0 |
0.2 |
1.0 |
|
UU05 |
0.0 |
0.0 |
0.2 |
1.0 |
|
UU06 |
0.0 |
0.0 |
0.2 |
1.0 |
|
UU07 |
0.0 |
0.0 |
0.2 |
1.0 |
|
UU08 |
0.0 |
0.0 |
0.2 |
1.0 |
|
UU09 |
0.0 |
0.0 |
0.1 |
1.0 |
|
UU10 |
0.0 |
0.0 |
0.1 |
1.0 |
|
UU11 |
0.0 |
0.0 |
0.1 |
1.0 |
|
UU12 |
Voided due to latest site programme
and on-going operation work |
1.0 |
||
|
UU13 |
0.0 |
0.0 |
0.1 |
1.0 |
|
UU14 |
0.0 |
0.0 |
0.1 |
1.0 |
|
UU15 |
0.0 |
0.0 |
0.1 |
1.0 |
|
UU16 |
0.0 |
0.0 |
0.1 |
1.0 |
|
UU17 |
Voided due to latest site programme
and on-going operation work |
1.0 |
||
|
UU18 |
0.1 |
0.0 |
0.2 |
1.0 |
|
UU19 |
0.0 |
0.0 |
0.1 |
1.0 |
|
UU20 |
0.0 |
0.0 |
0.1 |
1.0 |
|
UU21 |
0.0 |
0.0 |
0.1 |
1.0 |
|
UU22 |
0.0 |
0.0 |
0.1 |
1.0 |
|
UU23 |
0.0 |
0.0 |
0.1 |
1.0 |
|
UU24 |
0.0 |
0.0 |
0.1 |
1.0 |
|
UU25 |
0.0 |
0.0 |
0.1 |
1.0 |
|
UU26 |
0.1 |
0.0 |
0.4 |
1.0 |
|
UU27 |
0.1 |
0.0 |
0.4 |
1.0 |
|
UU28 |
0.1 |
0.0 |
0.2 |
1.0 |
Table 2.35 Summary of Landfill Gas bulk
sampling Monitoring Results in the reporting period
|
Parameters |
Limit
Level (LFG2) (a)
|
LFG2 |
Limit
Level (LFG8) (a)
|
LFG8 |
|
February 2024 |
||||
|
Methane
(% (v/v)) |
1.0 |
<0.020 |
12.6 |
<0.020 |
|
Carbon
Dioxide (% (v/v)) |
4.3 |
0.291 |
2.4 |
0.057 |
|
Oxygen
(% (v/v)) |
- |
19.5 |
- |
20.1 |
|
Nitrogen
(% (v/v)) |
- |
78.3 |
- |
78.2 |
|
Carbon
Monoxide (% (v/v)) |
- |
<0.020 |
- |
<0.020 |
|
Hydrogen
(% (v/v)) |
- |
<0.020 |
- |
<0.020 |
|
Ethane
(ppmv) |
- |
<1.0 |
- |
<1.0 |
|
Propane
(ppmv) |
- |
<1.0 |
- |
<1.0 |
|
Butane
(ppmv) |
- |
<1.0 |
- |
<1.0 |
|
Parameters |
Limit
Level (LFG2) (a)
|
LFG2 |
Limit
Level (LFG8) (a)
|
LFG8 |
|
May 2024 |
||||
|
Methane (% (v/v)) |
1.0 |
<0.020 |
12.6 |
<0.020 |
|
Carbon Dioxide (% (v/v)) |
4.3 |
0.624 |
2.4 |
0.089 |
|
Oxygen (% (v/v)) |
- |
19.5 |
- |
20.1 |
|
Nitrogen (% (v/v)) |
- |
78.3 |
- |
78.2 |
|
Carbon Monoxide (% (v/v)) |
- |
<0.020 |
- |
<0.020 |
|
Hydrogen (% (v/v)) |
- |
<0.020 |
- |
<0.020 |
|
Ethane (ppmv) |
- |
<1.0 |
- |
<1.0 |
|
Propane (ppmv) |
- |
<1.0 |
- |
<1.0 |
|
Butane (ppmv) |
- |
<1.0 |
- |
<1.0 |
|
Parameters |
Limit Level (LFG2) (a) |
LFG2 |
Limit Level (LFG8) (a) |
LFG8 |
|
August 2024 |
||||
|
Methane (% (v/v)) |
1.0 |
<0.020 |
12.6 |
<0.020 |
|
Carbon Dioxide (% (v/v)) |
4.3 |
1.14 |
2.4 |
0.16 |
|
Oxygen (% (v/v)) |
- |
19.2 |
- |
20.1 |
|
Nitrogen (% (v/v)) |
- |
79.5 |
- |
76.9 |
|
Carbon Monoxide (% (v/v)) |
- |
<0.020 |
- |
<0.020 |
|
Hydrogen (% (v/v)) |
- |
<0.020 |
- |
<0.020 |
|
Ethane (ppmv) |
- |
<1.0 |
- |
<1.0 |
|
Propane (ppmv) |
- |
<1.0 |
- |
<1.0 |
|
Butane (ppmv) |
- |
<1.0 |
- |
<1.0 |
|
Parameters |
Limit
Level (LFG4) (a) |
LFG4 |
Limit
Level (LFG6) (a) |
LFG6 |
|
November
2024 |
||||
|
Methane
(% (v/v)) |
1.0 |
<0.020 |
1.0 |
<0.020 |
|
Carbon
Dioxide (% (v/v)) |
7.0 |
0.063 |
9.1 |
0.128 |
|
Oxygen
(% (v/v)) |
- |
20.5 |
- |
20.3 |
|
Nitrogen
(% (v/v)) |
- |
76.4 |
- |
76.5 |
|
Carbon
Monoxide (% (v/v)) |
- |
<0.020 |
- |
<0.020 |
|
Hydrogen
(% (v/v)) |
- |
<0.020 |
- |
<0.020 |
|
Ethane
(ppmv) |
- |
<1.0 |
- |
<1.0 |
|
Propane
(ppmv) |
- |
<1.0 |
- |
<1.0 |
|
Butane
(ppmv) |
- |
<1.0 |
- |
<1.0 |
|
Notes: (a) Limit Levels established based on the pre-operation phase baseline and additional landfill gas monitoring results in the Pre-operation Baseline Monitoring Report |
||||
Table 2.36 Summary of flammable Gas surface emission monitoring Results
in the reporting period
|
GPS Coordinates Latitude (N) |
Longitude (E) |
Monitoring Results (ppm) |
Limit Level (ppm) |
|
February 2024 |
30 |
||
|
22o16’43” |
114o16’43” |
27 |
|
|
22o16’32” |
114o16’36” |
13 |
|
|
22o16’26” |
114o16’34” |
25 |
|
|
22o16’30” |
114o16’27” |
15 |
|
|
May 2024 |
|||
|
22o16’34” |
114o16’38” |
13 |
|
|
22o16’24” |
114o16’26” |
16 |
|
|
22o16’31” |
114o16’27” |
11 |
|
|
August 2024 |
|||
|
22o16’34” |
114o16’27” |
23 |
|
|
22°16’32” |
114°16’44” |
28 |
|
|
22o16’32” |
114°16’42” |
23 |
|
|
22°16’33” |
114°16’41” |
21 |
|
|
22°16’34” |
114°16’37” |
16 |
|
|
22°16’30” |
114°16’36” |
7 |
|
|
22°16’26” |
114°16’35” |
7 |
|
|
22°16’26” |
114°16’26” |
7 |
|
|
22°16’21” |
114°16’26” |
8 |
|
|
22°16’17” |
114°16’37” |
13 |
|
|
22°16’16” |
114°16’30” |
25 |
|
|
November 2024 |
|||
|
22°16’32” |
114°16’44” |
18 |
|
|
22°16’33” |
114°16’41” |
12 |
|
|
22°16’33” |
114°16’37” |
13 |
|
|
22°16’28” |
114°16’35” |
7 |
|
|
22°16’21” |
114°16’37” |
8 |
|
|
22°16’17” |
114°16’33” |
10 |
|
|
22o16’29” |
114o16’27” |
18 |
|
The alarm of the permanent gas monitoring systems with pre-set levels
for methane at 20% lower explosive limit (LEL, equivalent to 1% methane gas
(v/v)) was not triggered at all occupied
on-site buildings at SENTX from January 2024 to December 2024.
Limit Levels exceedance was
recorded for landfill gas monitoring in the reporting period and actions in
accordance with the Event and Action Plan presented in Annex G3 were undertaken.
Investigation of the Limit Levels exceedances was conducted
and the investigation report is presented in Annex G4.
Based on the investigation
conducted for the monitoring events with potential Limit Levels exceedance with
the Contractor and the IEC, the landfill gas (carbon dioxide) exceedance at
LFG17 on 13 August 2024 was considered non Project-related.
The Contractor was reminded to implement all relevant
mitigation measures for the construction and operation works and maintain good
site practice. The ET will keep track of the monitoring data and ensure
the Contractor’s compliance
of the environmental requirements.
According
to the updated EM&A Manual of the Project, the monthly landscape and visual audit was
conducted on 24 January 2024, 5 February 2024, 13 March 2024, 8 April 2024, 20
May 2024, 20 June 2024, 3 July 2024, 29 August 2024, 19 September 2024, 7
October 2024, 26 November 2024 and 19 and 31 December 2024 to monitor the implementation of the
landscape and visual mitigation measures during operation/ restoration phase.
All
relevant environmental mitigation measures listed in the approved EIA Report
and the updated EM&A Manual and their implementation status are summarized
in Annex B.
The
Contractor has implemented environmental mitigation measures as stated in the
approved EIA Report and the EM&A Manual.
Regarding
the landscape and visual audit, the Contractor was reminded to maintain the
advance screen planting works regularly to ensure
effective screening of views of project works from the High Junk Peak
Trail.
Site
inspections were carried out on a weekly basis with the Contractor, IEC and ER
to monitor the implementation of proper environmental pollution control and
mitigation measures under the Project. In the reporting period, 52 site
inspections were carried out on the following dates:
•
4, 11, 18 and 25 January 2024;
• 1, 8, 15,
22 and 29 February 2024;
• 7, 14, 21
and 28 March 2024;
• 3, 11, 18
and 24 April 2024;
• 2, 9, 16,
23 and 30 May 2024;
• 6, 13, 20
and 27 June 2024;
• 3, 11, 18
and 25 July 2024;
• 1, 8, 15,
22 and 29 August 2024;
• 5, 12, 19
and 26 September 2024;
• 3, 10, 17,
24 and 31 October 2024;
• 7, 15, 21
and 28 November 2024; and
• 5, 12, 18
and 24 December 2024.
Key
observations during the site inspections are summarised
in Table 2.37.
Table
2.37 Key Observations Identified during the Site Inspection in this Reporting
Month
|
Inspection Date |
Environmental Observations and Recommendations |
|
4
January 2024 |
· The Contractor shall enhance watering during the
excavation operation near DP3 to minimise dust impact. · The Contractor shall replace the faded NRMM labels
displayed on the excavators and display NRMM label on the generator at
sorting area. |
|
11
January 2024 |
· No observations during the site inspection. |
|
18
January 2024 |
·
The Contractor shall remove the general
refuse accumulated at X10 channel regularly to ensure it is functioning properly at all times. |
|
25
January 2024 |
· The Contractor shall remove the stockpiles near X10
channel to minimise the generation of high SS runoff and dust impact. |
|
1
February 2024 |
·
No observations during
the site inspection. |
|
8
February 2024 |
·
The Contractor shall replace
the faded NRMM label displayed on the excavator at Cell 4X. ·
The Contractor shall compact/remove
the stockpiles near X10 channel to minimise the generation of high SS runoff
and dust impact. ·
The Contractor shall remove the deposits and refuse accumulated at the
sediment trap regularly to ensure it is functioning
properly at all times. ·
The Contractor shall clean up the oil spillage near DP6 and handle the
clean up materials as chemical waste. |
|
15
February 2024 |
·
The Contractor shall display a
NRMM label on the excavator at Cell 4X. ·
The Contractor
shall cleanup the oil spillage at the excavator at Cell 4X and handle the
cleanup materials as chemical waste. |
|
22
February 2024 |
·
The Contractor shall install
silt fencing around DP3 outlet to minimise SS runoff to the discharge point. ·
The Contractor shall cover the
stockpiles near X10 channel to minimise the generation of high SS runoff and
dust impact. · The Contractor shall arrange regular cleaning and
removal of deposit and grit along the main haul road, especially near site
entrance to minimise and to be carried on the public road. |
|
29
February 2024 |
·
The Contractor shall cover the
stockpiles near X10 channel to minimise the generation of high SS runoff and
dust impact. |
|
7 March
2024 |
·
No observations during
the site inspection. |
|
14
March 2024 |
· No observations during the site inspection. |
|
21
March 2024 |
· No observations during the site inspection. |
|
28
March 2024 |
·
The Contractor shall replace
the faded NRMM label displayed on the loader near sediment trap. · The Contractor shall remove the general refuse and
deposited silt accumulated at the RC15 channel regularly to ensure it is functioning properly at all times. |
|
3 April
2024 |
· No observations during the site inspection. |
|
11
April 2024 |
·
No observations during the site
inspection. |
|
18
April 2024 |
· The Contractor shall remove the deposited silt and grit
accumulated at DP3 sediment pit regularly to ensure it is functioning
properly at all times. |
|
24
April 2024 |
·
The Contractor shall
remove the general refuse accumulated at X10 channel drop inlet to ensure it
is functioning properly at all times. ·
The Contractor shall remove the
deposited silt, grit and general refuse accumulated at DP4 sediment pit and
outlet regularly to ensure it is functioning properly at
all times. ·
The Contractor shall install
extra silt fencing/ place sandbag at X10 channel to minimize high SS runoff
to the channel. · The Contractor shall review the treatment capacity of
the Wetseps at DP3, DP4 and DP6 to ensure all
surface water it is treated before discharge. |
|
2 May
2024 |
·
The Contractor shall remove the
deposited silt and grit accumulated at X10 channel regularly to ensure it is functioning properly at all times. ·
The Contractor shall adjust the
pH of Wetsep 2 at DP4 to ensure all surface water
is treated within pH 6-9 before discharge. |
|
9 May
2024 |
·
The Contractor shall repair the
silt fencing at X10 channel near Pump House No.3 to minimize SS runoff to the
channel. |
|
16 May
2024 |
·
The Contractor shall remove the
general refuse accumulated at DP3 to prevent general refuse drops into
sediment trap. |
|
23 May
2024 |
·
The Contractor shall review Wetsep treatment efficiency at DP3 to prevent
non-compliance with the WPCO standard and EM&A requirement. ·
The Contractor shall repair the
silt fencing at X10 channel near Pump House No.3 to minimize SS runoff to the
channel. ·
The Contractor shall remove the
deposited silt and grit accumulated at X10 channel regularly to ensure it is functioning properly at all times. · The Contractor remove the
stagnant water and chemicals in the drip trays of Wetseps
near DP4 and handle the clean-up materials as chemical waste. |
|
30 May
2024 |
·
The Contractor shall remove the
deposited silt and grit accumulated at X10 channel regularly to ensure it is functioning properly at all times. |
|
6 June
2024 |
·
The Contractor shall review Wetsep treatment efficiency at DP4 to prevent
non-compliance with the WPCO standard and EM&A requirement. ·
The Contractor shall remove the
stagnant water and chemicals in the drip trays of Wetseps
near DP4 and handle the clean-up materials as chemical waste. |
|
13 June
2024 |
·
The Contractor shall remove the
general refuse accumulated at DP4 sediment pit regularly to ensure it is functioning properly at all times. · The Contractor shall review the treatment capacity of
the Wetseps at DP3, DP4 and DP6 to ensure all
surface water it is treated before discharge. |
|
20 June
2024 |
·
The Contractor shall
remove the deposited silt and grit accumulated at X10 channel regularly to
ensure it is functioning properly at all times. ·
The Contractor shall
remove the general refuse, deposited silt and grit accumulated at DP4
sediment pit regularly to ensure it is functioning properly
at all times. ·
The Contractor shall remove the stagnant water and chemicals in the
drip trays of Wetseps near DP4 and handle the
cleanup materials as chemical waste. · The Contractor shall repair the silt fencing along DP6
channel to minimize SS runoff to the channel. |
|
27 June
2024 |
·
The Contractor shall remove the
deposited silt and grit accumulated at DP3 sediment pit regularly to ensure
it is functioning properly at all times. ·
The Contractor shall remove the
deposited silt and grit accumulated at X10 channel and repair the silt
fencing along X10 channel to minimize SS runoff to channel. ·
The Contractor remove the deposited silt and grit accumulated at DP4
sediment pit regularly to ensure it is functioning properly
at all times. ·
The Contractor shall review the
treatment capacity of the Wetseps at DP3 and DP4 to
ensure all surface water it is treated before discharge. |
|
3 July
2024 |
· The Contractor shall remove the general refuse,
deposited silt and grit accumulated at DP3 sediment pit regularly to ensure
it is functioning properly at all times. ·
The Contractor shall remove the
deposited silt and grit accumulated at DP4 sediment pit regularly to ensure
it is functioning properly at all times. |
|
11 July
2024 |
· The Contractor shall remove the deposited silt and grit
accumulated at DP4 sediment pit regularly to ensure it is functioning
properly at all times. |
|
18 July
2024 |
·
The Contractor shall
remove the deposited silt and grit accumulated at X10 channel regularly to
ensure it is functioning properly at all times. ·
The Contractor shall remove the
general refuse, deposited silt and grit accumulated at DP4 sediment pit
regularly to ensure it is functioning properly at all times. ·
The Contractor shall review Wetsep treatment efficiency at DP4 to prevent
non-compliance with the WPCO standard and EM&A requirement. · The Contractor shall remove the stagnant water and
chemicals in the drip trays of Wetsep 1 near DP4
and handle the clean-up materials as chemical waste. |
|
25 July
2024 |
· The Contractor shall remove the general refuse, deposited silt and grit
accumulated at DP4 sediment pit regularly to ensure it is functioning
properly at all times. |
|
1
August 2024 |
· The Contractor
shall remove the stagnant water and chemicals in the drip trays of Wetseps near DP4 and handle the clean-up materials as
chemical waste. |
|
8
August 2024 |
· The Contractor shall remove the general refuse,
deposited silt and grit accumulated at DP4 sediment pit regularly to ensure
it is functioning properly at all times. |
|
15
August 2024 |
·
The Contractor shall remove the
deposited silt and grit accumulated at DP4 sediment pit regularly to ensure
it is functioning properly at all times.. ·
The Contractor shall remove the
stagnant water and chemicals in the drip trays of Wetsep
1 near DP4 and handle the clean-up materials as chemical waste. |
|
22
August 2024 |
·
The Contractor shall remove the
deposited silt and grit accumulated near the road of DP3 regularly to
minimize SS runoff to the DP3 sediment pit. ·
The Contractor shall repair the
silt fencing along X10 channel to minimize SS runoff to the channel. ·
The Contractor shall remove the
deposited silt and grit accumulated at DP4 sediment pit regularly to ensure
it is functioning properly at all times. ·
The Contractor shall review Wetsep treatment efficiency at DP4 to prevent
non-compliance with the WPCO standard and EM&A requirement. |
|
29
August 2024 |
·
The Contractor shall remove the deposited silt and grit accumulated
near the road of DP3 regularly to minimize SS runoff to the DP3 sediment pit. ·
The Contractor shall remove the deposited silt and grit accumulated at
DP4 sediment pit regularly to ensure it is functioning
properly at all times. |
|
5
September 2024 |
·
The Contractor shall
remove the general refuse accumulated at DP3 sediment pit regularly to ensure
it is functioning properly at all times. ·
The Contractor shall arrange
regular cleaning and removal of deposits along access road near DP3 to
minimise SS runoff to the DP3 sediment pit. ·
The Contractor shall remove the
deposited silt and grit accumulated at DP4 sediment pit regularly to ensure
it is functioning properly at all times. |
|
12
September 2024 |
·
The Contractor shall
remove the general refuse, deposited silt and grit accumulated at DP4
sediment pit regularly to ensure it is functioning properly
at all times. |
|
19
September 2024 |
·
The Contractor shall remove the
general refuse at DP3 sediment pit regularly to ensure it is functioning properly at all times. ·
The Contractor shall remove the
general refuse, deposited silt and grit accumulated at DP4 sediment pit
regularly to ensure it is functioning properly at all times. |
|
26
September 2024 |
·
The Contractor shall remove the
general refuse, the deposited silt and grit at DP4 sediment pit regularly to
ensure it is functioning properly at all times. · The Contractor shall review the treatment efficiency of
Wetsep at DP6 to ensure compliance with the WPCO
and EM&A requirement. |
|
3 October
2024 |
· The Contractor shall remove the general refuse, the
deposited silt and grit at DP3 sediment pit regularly to ensure it is functioning properly at all times. · The Contractor shall remove the general refuse, the
deposited silt and grit at DP4 sediment pit regularly to ensure it is functioning properly at all times. ·
The Contractor shall remove the
stagnant water and chemicals in the drip trays of Wetseps
near DP4 and handle the cleanup materials as chemical waste. |
|
10
October 2024 |
·
The Contractor shall remove the
general refuse accumulated at DP4 outlet and deposited silt and grit at DP4
sediment pit regularly to ensure it is functioning properly
at all times. ·
The Contractor shall review Wetseps
treatment efficiency at DP4 to ensure compliance with the WPCO standard and
EM&A requirements. |
|
17
October 2024 |
·
The Contractor shall remove the
general refuse, deposited silt and grit accumulated at X10 channel near Sump
House No.2 to ensure it is functioning properly at all
times. · The Contractor shall repair the silt fencing along X10
channel near Sump House No. 2 to minimize SS runoff to the channel. |
|
24
October 2024 |
·
The Contractor shall
remove the general refuse accumulated at DP3 sediment pit to ensure it is functioning properly at all times. ·
The Contractor shall remove the
deposited silt and grit accumulated at DP4 sediment pit to ensure it is functioning properly at all times. |
|
31 October 2024 |
·
The Contractor shall clean up
the oil spillage near SENTx vehicle washing
facility and handle the clean-up materials as chemical waste. ·
The Contractor shall remove the
deposited silt and grit accumulated at DP4 sediment pit to ensure it is functioning properly at all times. |
|
7 November 2024 |
·
The Contractor shall remove the
general refuse accumulated at X10 channel near DP3 regularly to ensure it is functioning properly at all times. ·
The Contractor shall remove the
deposited silt and grit accumulated at DP4 sediment pit regularly to ensure
it is functioning properly at all times. |
|
15 November 2024 |
·
The Contractor shall remove the
general refuse accumulated at DP3 sediment pit regularly to ensure it is functioning properly at all times. ·
The Contractor shall remove the
deposited silt and grit accumulated at X10 channel near DP3 regularly to
ensure it is functioning properly at all times. ·
The Contractor shall compact/remove
the stockpiles near X10 channel to minimise the generation of high SS runoff
and dust impact. ·
The Contractor shall remove the
deposited silt and grit accumulated at DP4 sediment pit to ensure it is functioning properly at all times. ·
The Contractor shall review
the treatment capacity of the Wetseps at DP4 to
ensure all surface water is treated before discharge. |
|
21
November 2024 |
·
The Contractor shall continue
to remove the deposited silt and grit accumulated at DP4 sediment pit to
ensure it is functioning properly at all times. ·
The Contractor shall clean up
the oil spillage near DP4 and handle the clean-up materials as chemicals
waste. ·
The Contractor shall remove the
stagnant water and chemicals in the drip trays of Wetseps
near DP4 and handle the clean-up materials as chemical waste. |
|
28
November 2024 |
·
The Contractor
shall remove the fallen leaves accumulated at DP3 sediment pit to ensure it
is functioning properly at all times. ·
The Contractor
shall remove the general refuse accumulated at X10 channel to ensure it is functioning properly at all times. ·
The Contractor shall remove the
deposited silt and grits accumulated at DP4 sediment pit to ensure it is functioning properly at all times |
|
5
December 2024 |
·
The Contractor shall
remove the general refuse accumulated at X10 channel near Pump House No. 4 to
ensure it is functioning properly at all times. ·
The Contractor shall remove the deposited silt and grit accumulated at
DP4 sediment pit to ensure it is functioning properly at
all times. |
|
12 December 2024 |
·
The Contractor shall
remove the general refuse accumulated at X10 channel to ensure it is functioning properly at all times. ·
The Contractor shall remove the
deposited silt and grit accumulated at DP4 sediment pit to ensure it is functioning properly at all times. |
|
18 December 2024 |
·
The Contractor shall continue
to remove the general refuse, deposited silt and grit accumulated at DP4
outlet and sediment pit to ensure it is always functioning properly. |
|
24 December 2024 |
·
The Contractor shall remove the
general refuse accumulated at DP4 outlet regularly to ensure it is functioning properly at all times. |
|
|
The Contractor has rectified all observations identified during
environmental site inspections in the reporting period. Key environmental
deficiencies identified and the corresponding
rectification actions are presented in Table 2.37.
Table 2.38
Summary of Environmental Deficiencies Identified and Corresponding
Rectification Actions
|
Deficiencies |
Rectifications Implemented |
Proposed Additional Control Measures |
|
Surface Water |
||
|
Intercepting channels & drainage system |
· Reviewed drainage plan. |
· Addition of channels. · Expedite the construction of permanent sediment trap and discharge culverts. |
|
DP channels (design & regular silt removal) |
· Carried out regular maintenance and cleaning of channels. · DP4 channel: Area near the channel was paved with concrete and a bund was built. · DP6 channel: Gravel piles on the channel were covered with concrete which serve as blocks for running water and to divide the channel into several sections. A pump was placed in the water zone in the upstream section to pump water to the Wetsep for treatment prior to the discharge to the last section before the weir plate. · DP6: Pipes through the gravel piles between different channel sections were covered with geotextiles to block debris and silt. |
N.A. |
|
Stockpiles & exposed soil |
·
Installed silt fencing near surface
water channel along DP6 channel. |
·
Improve soil covering. ·
Compaction and cover for stockpiles and soil slopes. |
|
Wetsep (treatment capacity & number) |
·
Reviewed Wetsep
capacity. ·
Chemicals dosage of the Wetsep was increased to enhance the efficiency. |
·
Install additional Wetsep. |
|
Backflow / ponding during heavy rainfall |
·
Raised with EPD (LDG) and CEDD. |
N.A. |
The
Contractor has registered as chemical waste producer under the Contract. Sufficient numbers of receptacles were available for general
refuse collection and sorting.
As
informed by the Contractor, waste generated during this reporting period includes inert C&D
materials, non-inert C&D waste, yard waste, recyclable materials and
chemical wastes. Reference has been made to the waste flow table prepared
by the Contractor. The quantities of different types of wastes and
imported fill materials are summarized in Table 2.39.
Table 2.39 Quantities of Different Waste
Generated and Imported Fill Materials
|
Month/Year |
Inert C&D Materials (a) (in ‘000m3) |
Imported
Fill |
Inert
Construction Waste Re-used |
Non-inert
Construction Waste (c) |
Recyclable Materials (d) (in ‘000kg) |
Yard Waste (in ‘000kg)
|
Chemical
Wastes |
||
|
Rock |
Soil |
Y Park |
SENT |
||||||
|
Jan 24 |
379.89 |
0 |
0 |
0 |
0.26 |
0 |
0 |
0 |
0.80 |
|
Feb 24 |
156.39 |
0 |
0 |
0 |
0 |
0 |
2.66 |
0 |
0.80 |
|
Mar 24 |
86.62 |
0 |
0 |
0 |
0 |
0 |
0 |
0 |
0.80 |
|
Apr 24 |
0 |
0 |
0 |
0 |
0 |
0.28 |
3.23 |
0 |
0.91 |
|
May 24 |
0 |
0 |
0 |
0 |
0 |
0 |
0 |
0 |
0.80 |
|
Jun 24 |
0 |
0 |
0 |
0 |
0 |
0.25 |
0 |
0 |
0.80 |
|
Jul 24 |
0 |
0 |
0 |
0 |
0 |
0 |
0 |
0 |
0.91 |
|
Aug 24 |
0 |
0 |
0 |
0 |
0 |
0 |
0 |
0 |
0.80 |
|
Sep 24 |
0 |
0 |
0 |
0 |
0 |
0 |
6.68 |
0 |
0.80 |
|
Oct 24 |
0 |
0 |
0 |
0 |
0 |
0.25 |
0 |
0 |
0.80 |
|
Nov 24 |
0 |
0 |
0 |
0 |
0 |
0 |
0 |
0 |
0.80 |
|
Dec 24 |
0 |
0 |
0 |
0 |
0 |
0 |
0 |
0 |
1.04 |
|
Notes: (a) Inert construction wastes include hard rock and large broken concrete, and materials disposed as public fill. Density assumption: 1.6 (kg/L) for public fill. (b) Imported fill refers to materials generated from other project for on-site reuse. (c) Non-inert construction wastes include general refuse disposed at landfill. Density assumption: 0.9 (kg/L) for general refuse. (d) Recyclable materials include metals, paper, cardboard, plastics and others. |
|||||||||
A summary
of the Environmental Mitigation Implementation Schedule is presented in Annex B. The necessary
mitigation measures were implemented properly for the Project.
The
operation/ restoration phase noise monitoring results complied with the Action
and Limit Levels in the reporting period.
Four exceedances of Action and Limit Levels for dust
(TSP), two exceedances of Limit Level for landfill gas flare stack emission (Benzene), one
exceedance of Limit Levels for landfill gas flare stack emission (carbon
monoxide (CO)), one exceedance of the Limit Levels for surface water
(ammoniacal-nitrogen), two exceedances of the Limit Levels for surface water
(suspended Solids (SS)), four exceedances of the Limit Level for groundwater
(ammoniacal-nitrogen), twelve exceedances of the Limit Level for groundwater
(COD), one exceedance of the Limit Level for perimeter landfill gas (carbon
dioxide) were recorded in the reporting period.
The TSP exceedances at AM1 on 2 and 8 January 2024, 14
and 26 March 2024 were considered non Project-related
upon further investigation.
The landfill gas flare stack emission (Benzene and CO)
exceedances on 18 April 2024 and the landfill gas flare stack emission
(Benzene) exceedance on 9 May 2024 were considered Project-related upon further
investigation.
The surface
water (ammoniacal-nitrogen) exceedance at DP3 and the surface water (SS)
exceedances at DP4 and DP6 on 6 May 2024 and 12 June 2024, respectively, were
found deemed to Project-related activities upon further investigation.
The groundwater (ammoniacal-nitrogen) exceedance at
MWX-6 on 6 March 2024, at MWX-5 on 3 May 2024, at MWX-7 on 5 August 2024 and 3
December 2024 were considered non Project-related and the groundwater (COD)
exceedances at MWX-5 on 3 May 2024, at MWX-6 on 8 January 2024, 1 February 2024
and 6 March 2024, 10 April 2024 and 3 May 2024, at MWX-7 on 12 June 2024, 5
July 2024, 5 August 2024 and 3 December 2024, at MWX-8 on 6 March 2024, at
MWX-9 on 5 July 2024 were considered non Project-related upon further investigation.
The perimeter landfill gas (carbon dioxide) exceedance
at LFG17 on 13 August 2024 was considered non Project-related
upon further investigation.
Cumulative
statistics on exceedances is provided in Annex H.
There were
no complaints, notification of summons or prosecution
recorded in the reporting period.
Statistics
on complaints, notifications of summons, successful prosecutions are summarised in Annex H.
This
Annual EM&A Report presents the findings of the EM&A activities
undertaken during the period from
1 January 2024 to 31 December 2024 in accordance with the updated EM&A
Manual and the requirements of the Environmental Permit (EP-308/2008/C).
Four exceedances of Action and Limit Levels for dust
(TSP), two exceedances of Limit Level for landfill gas flare stack emission (Benzene) and
one exceedance of Limit
Levels for landfill gas flare stack emission (CO), one exceedance
of the Limit Levels for surface water (ammoniacal-nitrogen), two exceedances of
the Limit Levels for surface water (SS), four exceedances of the Limit Level
for groundwater (ammoniacal-nitrogen), twelve exceedances of the
Limit Level for groundwater (COD) and one exceedance of the Limit Levels for
perimeter landfill gas (carbon dioxide) were recorded in the reporting period.
Fifty-two environmental site inspections were carried
out during the reporting period. Environmental deficiencies were
identified during the site. inspection and the Contractor has
proposed additional control measures to rectify the deficiencies.
There were no complaints, notification
of summons or prosecution recorded in the reporting period.
It is noted that most environmental pollution control
and mitigation measures were properly implemented and
the construction and operation
activities of the Project did not introduce any adverse impact to the sensitive receivers in the reporting period. Yet,
some environmental deficiencies were identified during the reporting period and
additional control measures have been proposed by the Contractor to rectify the
corresponding deficiencies. The monitoring programme
has been reviewed and was considered as adequate to cater for the nature of
works in progress. Change to the monitoring programme
was thus not recommended at this stage. The monitoring programme
will be evaluated as appropriate in the next reporting period. The ET will keep
track of the construction works to
confirm compliance of environmental requirements and
the proper implementation of all necessary mitigation measures.
|